A new SSRS Opinion Panel Omnibus poll of employed adults nationally finds that:
- About one-third (34%) of employed adults report that the responsibilities of their job can for the most part be done from home.
- Overall, about three in ten employed adults (29%) report that they ever work from home.[1] The proportion of employed adults who report ever working from home varies by household income and education, between urban, suburban, and rural residents, as well as by age and party identification.
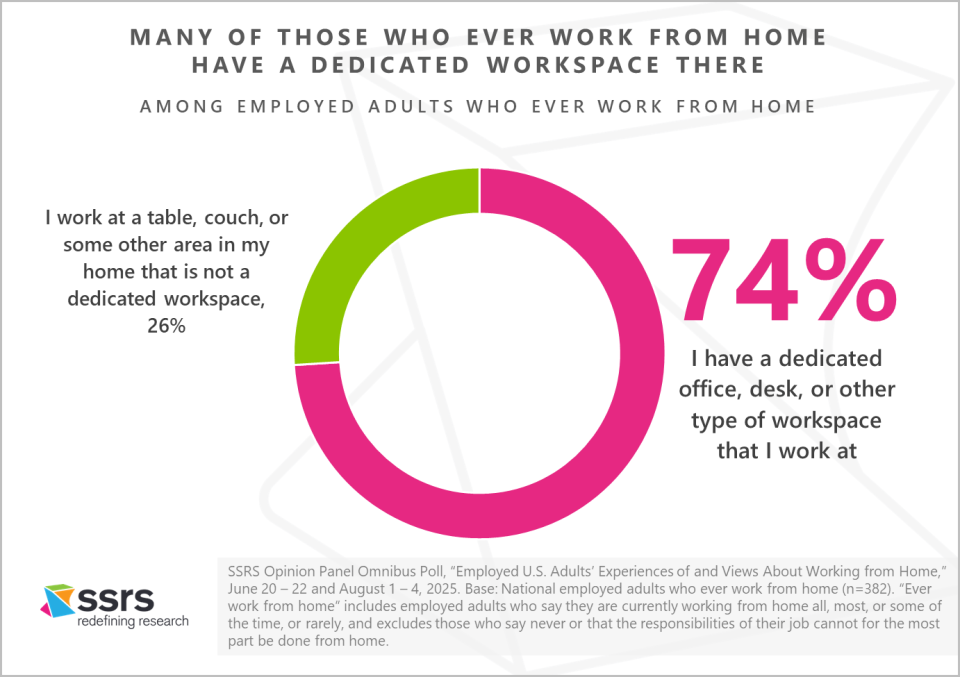
- Nearly three-fourths (74%) of those who ever work from home report having a dedicated office, desk, or other type of workspace where they work at home; 26% say they work at a table, couch, or some other area in their home that is not a dedicated workspace.
These findings are part of an SSRS Opinion Panel Omnibus poll conducted June 20 – 22 and August 1 – 4, 2025, among a nationally representative sample of 1,275 employed adults aged 18 and older.
[1] “Ever work from home” includes employed adults who say they are currently working from home all, most, or some of the time, or rarely, and excludes those who say never or that the responsibilities of their job cannot for the most part be done from home.
How many employed U.S. adults work from home?
About one-third (34%) of employed U.S. adults report that, regardless of their current job arrangement, the responsibilities of their job can for the most part be done from home.
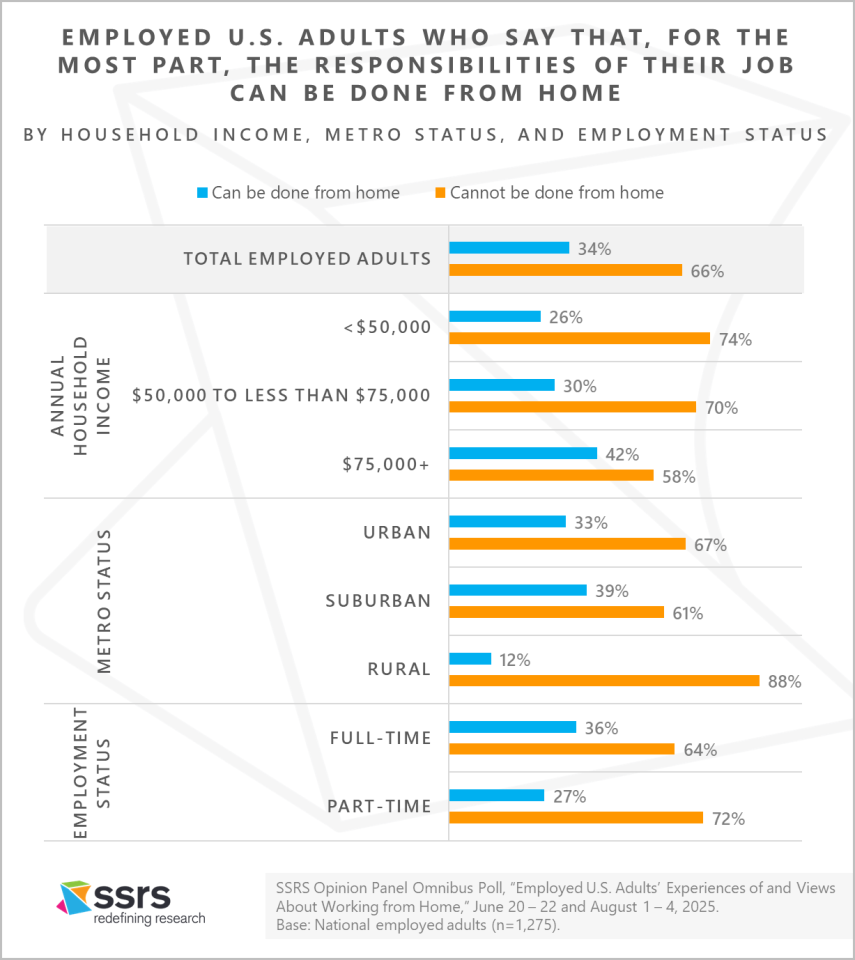
Employed adults with household incomes of $75,000 or more per year (42%) are more likely than those from households with incomes less than $50,000 (26%) or $50,000 to less than $75,000 (30%) to report that the responsibilities of their job can be done from home.
Employed adults living in suburban (39%) and urban areas (33%) are more likely than those from rural areas (12%) to report that the responsibilities of their job can be done from home.
Full-time employees (36%) are more likely than part-time employees (27%) to say their job’s responsibilities can be done from home. There are no significant differences by gender or age.
Among those employed adults who say the responsibilities of their job can for the most part be done from home, about half (49%) report that currently they work from home all (27%) or most of the time (22%), 36% that they sometimes (25%) or rarely do (11%), and 15% that they never work from home.
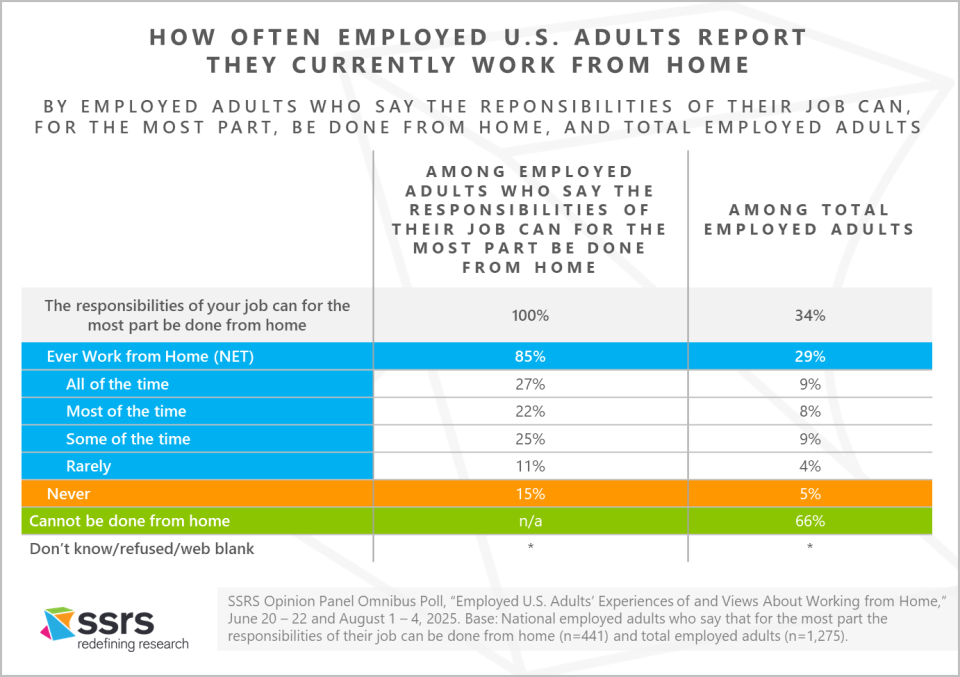
Overall, about three in ten total employed adults (29%) report that they ever work from home, including 17% who say they work from home all or most of the time.
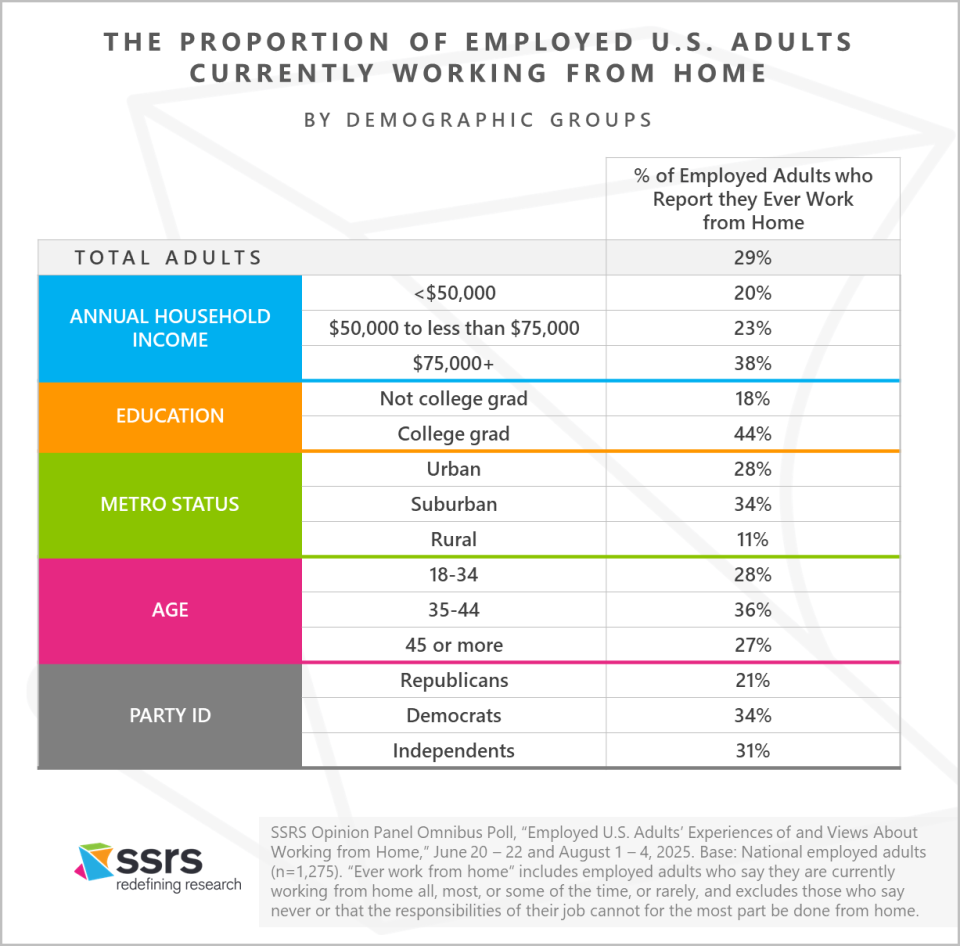
The proportion of employed adults who report ever working from home varies by household income and education, between urban, suburban, and rural residents, as well as by age and party identification.
Employed adults with household incomes of $75,000 or more per year (38%) are more likely than those from households with incomes less than $50,000 (20%) or $50,000 to less than $75,000 (23%) to report they ever work from home. Among employed adults, college graduates are more likely than those without a college degree (44% to 18%) to say they ever work from home.
Among employed adults, those living in suburban (34%) and urban areas (28%) are more likely than those from rural areas (11%), and 35-44-year-olds (36%) more likely than 18-34-year-olds (28%) and those aged 45 or more (27%) to report they ever work from home.
Also, among employed adults, Democrats (34%) and Independents (31%) more likely than Republicans (21%) to report ever working from home. There is no significant difference by gender.
How much do employed U.S. adults work from home?
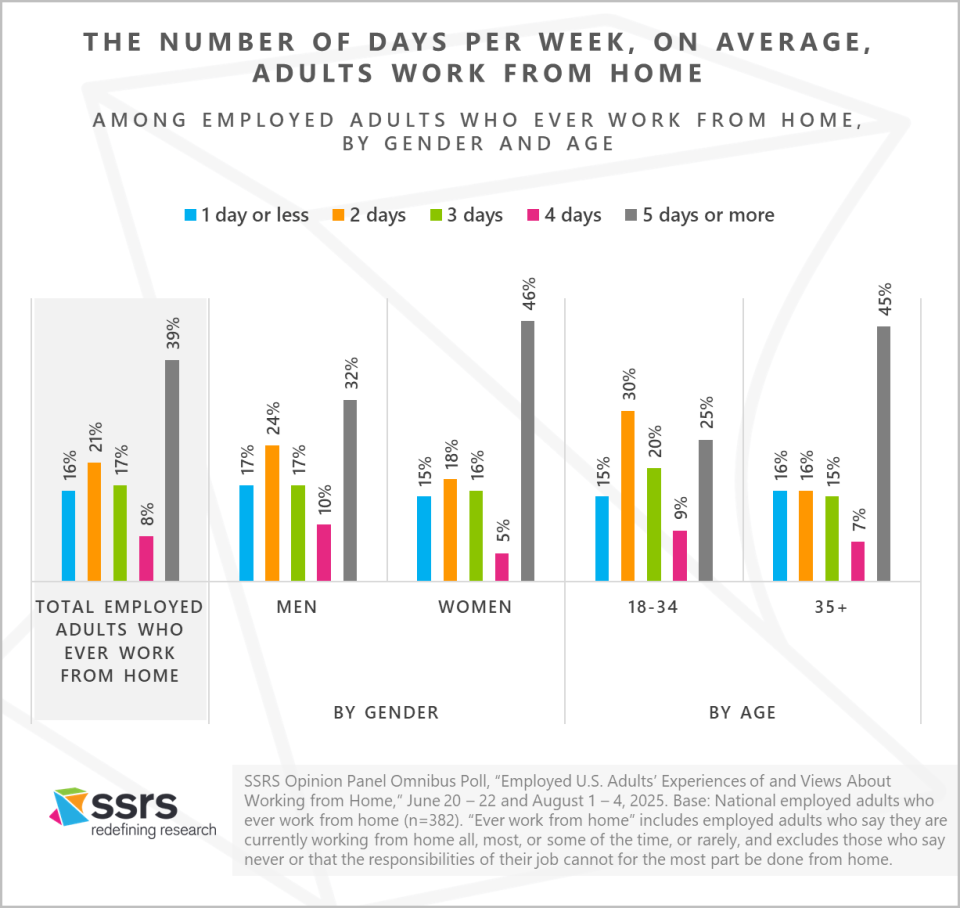
Among those who ever work from home, nearly four in ten (39%) report that they work from home five or more days a week on average, and one in six (16%) say they work from home one day or less per week. Nearly half (46%) report that during an average week, they work 2-4 days from home.
Among those who say they ever work from home, women (46%) are more likely than men (32%) to report that they work five or more days a week from home, and 18-34-year-olds (25%) are less likely than those aged 35 or over (45%).
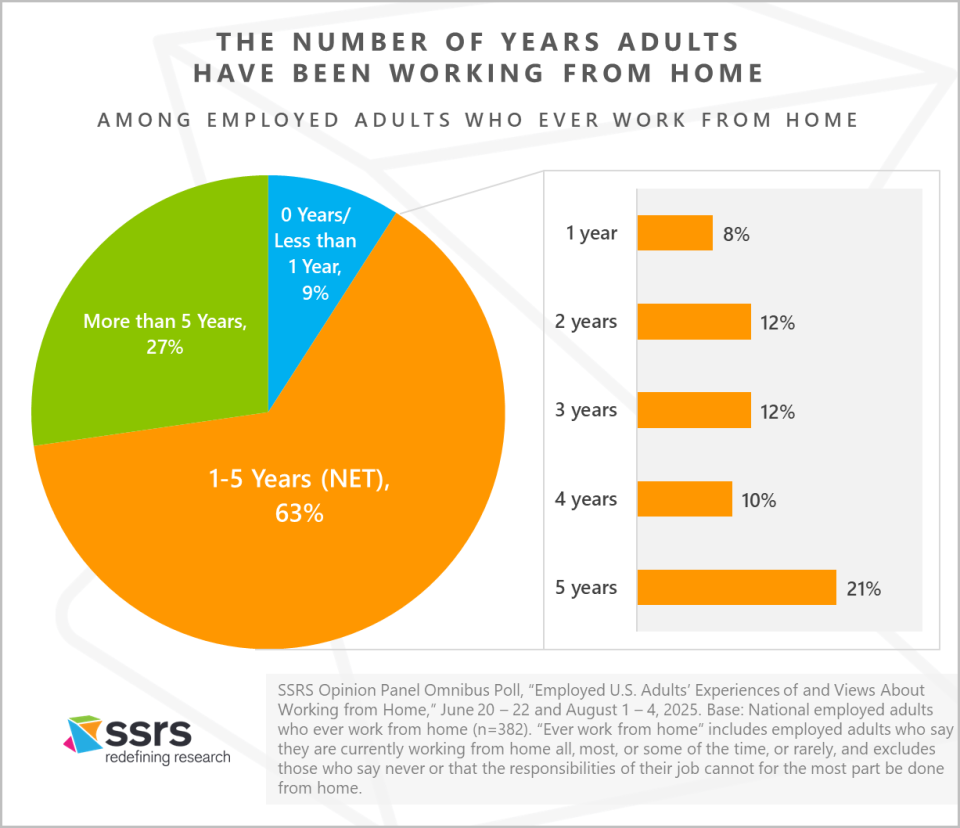
More than six in ten (63%) of those who ever work from home report that they have been working from home for one to five years, while 27% say they have been working from home for more than 5 years. Nine percent report that they have been working from home for less than a year.
How many employed U.S. adults who work from home have a dedicated workspace?
Nearly three-fourths (74%) of those who ever work from home report having a dedicated office, desk, or other type of workspace where they work at home; 26% say they work at a table, couch, or some other area in their home that is not a dedicated workspace.
Those who say their home is owned (78%) are more likely than those who say their home is rented (64%) to report that they have a dedicated workspace at home.
What options do employed adults have or want for working more or less from home?
Many of those whose job responsibilities can for the most part be done from home have options for how often they work from home.
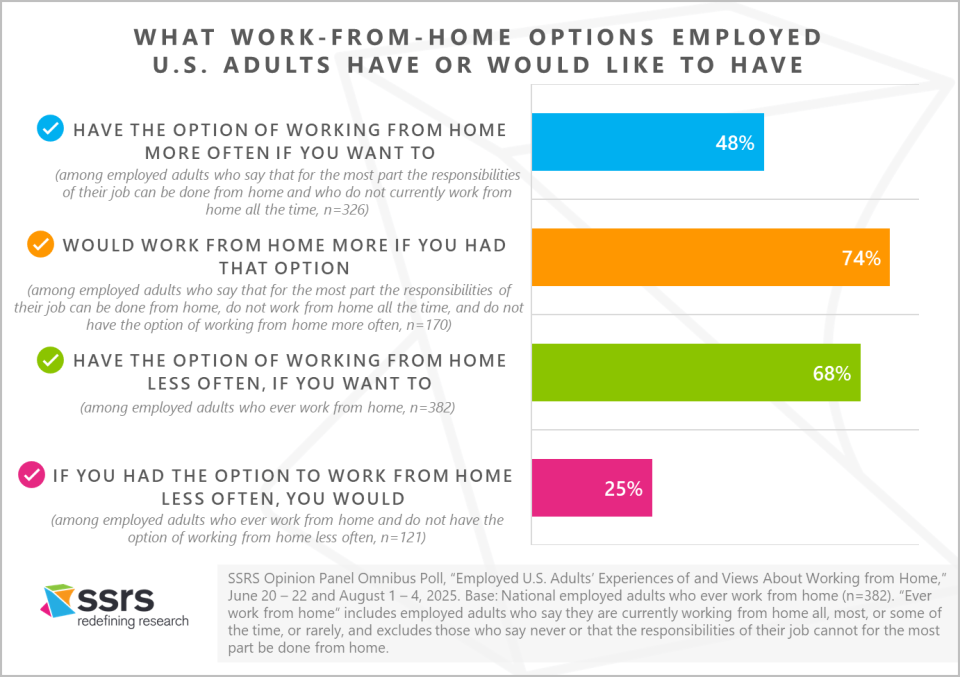
Among those who say that for the most part the responsibilities of their job can be done from home and who do not currently work from home all the time, about half (48%) report that they have the option of working from home more often.
Among those who say that for the most part the responsibilities of their job can be done from home, do not work from home all the time, and do not have the option of working from home more often, nearly three-fourths (74%) report that they would work from home more if they had that option.
About two-thirds (68%) of those who ever work from home report that they have the option of working from home less often, if they want to.
Among those who ever work from home and do not have the option of working from home less often, one in four (25%) say that if they did have the option to work from home less often, they would.
Methodology
Interviews for this study were conducted on the SSRS Opinion Panel Omnibus on June 20 – 22 and August 1 – 4, 2025, among a nationally representative sample of 1,275 employed adult respondents aged 18 and older. The margin of error for total respondents is +/-3.1 percentage points at the 95% confidence level. The design effect is 1.26.
The SSRS Opinion Panel Omnibus is a multi-client, probability-based survey that fields twice a month. It delivers a nationally representative sample of 1,000 adults aged 18 or older. Data collection is conducted online and via phone (for non-internet and web-reluctant respondents) using the probability-based SSRS Opinion Panel.
All SSRS Opinion Panel Omnibus data are weighted to represent the target population of U.S. adults aged 18 or older. View the questions used for this analysis, along with the responses (topline) >>
The SSRS Opinion Panel Omnibus is conducted on the SSRS Opinion Panel. SSRS Opinion Panel members are recruited randomly based on a nationally representative ABS (Address Based Sample) design (including Hawaii and Alaska). ABS respondents are randomly sampled by Marketing Systems Group (MSG) through the U.S. Postal Service’s Computerized Delivery Sequence File (CDS), a regularly updated listing of all known addresses in the U.S. For the SSRS Opinion Panel, known business addresses are excluded from the sample frame.
The SSRS Opinion Panel is a multi-mode panel (web and phone). Most panelists take self-administered web surveys; however, the option to take surveys conducted by a live telephone interviewer is available to those who do not use the internet as well as those who use the internet but are reluctant to take surveys online. All sample drawn for this study were SSRS Opinion Panelists who are U.S. adults aged 18 or older. Sample was selected to ensure representation by age, gender, race and ethnicity, education, Census region, and party identification. Possible sources of non-sampling error include non-response bias, as well as question wording and ordering effects.