Introduction
Reporting by the Pew Research Center and other researchers has drawn attention to the problem of bogus respondents in online opt-in (nonprobability) samples. These can include “bots” that use artificial intelligence (AI) technology to automatically complete online surveys. They can also include respondents who are real people but do not provide accurate data in their responses—for example, “professional survey respondents” who respond at random to claim incentives as quickly as possible, or respondents who are simply distracted or inattentive to that particular survey.
This is not a trivial problem—bogus respondents have driven large and consequential errors in survey estimates from opt-in samples. Often, these manifest as an extreme “positivity bias” that overstates the incidence of rare opinions or behaviors by orders of magnitude.
In prior work, we have shown how a parallel probability-based sample can help to correct selection biases in opt-in samples, via advanced weighting and blending methods such as SSRS’s Encipher® Hybrid calibration. Selection biases are driven by the fact that legitimate opt-in respondents, on average, have different characteristics, attitudes, and behaviors from the general population. The resulting biases can often be mitigated by weighting, but only if the respondents provided accurate data about themselves.
The problem of bogus respondents is different, and arguably more difficult to mitigate. Errors driven by bogus respondents cannot be corrected by weighting, even by advanced methods like Encipher®. The only solution is to prevent them from entering the survey in the first place, or to identify them and remove them after collection. Fortunately, a parallel probability sample can also help with this.
In this methodological brief, we show how administering a survey to both an opt-in sample and the probability-based SSRS Opinion Panel, and applying a machine learning algorithm, helps identify and remove low-quality responses in the opt-in sample.
Even if it is not feasible to use probability-based sources for an entire sample, these results demonstrate the value of including at least some probability-based sample alongside an opt-in sample. As with Encipher® calibration, the inclusion of some probability-based sample is critical to the success of this method—we will show that even advanced machine learning models are much less effective when they do not have a probability sample to “learn” from.
The methodology we demonstrate here is a way to help catch potential bad respondents on the “back end”, that is, after data have been collected. It should be considered a complement to, rather than a replacement for, “front-end” measures that aim to prevent bad respondents from entering the survey to begin with.
What are opt-in samples, and why are they vulnerable to bogus respondents?
By opt-in samples—also referred to as nonprobability samples—we mean online samples that anyone with Internet access can volunteer to join. As detailed in a 2022 report by the American Association for Public Opinion Research, there are many types of opt-in samples. These include panels, which are pools of respondents who have signed up to periodically receive surveys, as well as non-panel samples such as intercept or “river” samples. The common denominator is the openness of recruitment.
Open recruitment creates a risk of infiltration at scale by bogus respondents. For example, AI-powered bots can be programmed to create numerous false accounts in online panels and then take hundreds of surveys per day. Similarly, online intercept samples can be infiltrated if a bot or other bad actor finds an open link to the survey.
In contrast, probability samples—including probability-based panels like the SSRS Opinion Panel—are “closed”. Though respondents may still complete the survey online, they can only do so after being randomly selected, using a method such as address-based sampling (ABS) or random digit dialing (RDD).
Probability samples are not immune from data quality problems. Real survey respondents are human, and all humans are sometimes careless or rushed. However, the closed nature of recruitment makes probability samples much less susceptible to infiltration at scale by intentionally fraudulent actors.
- No bot or person can proactively join a probability panel or sample. A bad actor would need to be randomly sampled to have access to the panel or survey.
- Since the incidence of intentionally fraudulent actors in the population is very low, it will be similarly low in any random sample from the population.
- Even if a fraudulent actor happened to be randomly selected, they could only join a panel or complete a survey once. Invitees are provided with unique links that make it impossible to create multiple panel accounts or submit multiple responses to a given survey. This limits both the potential financial reward from fraudulent survey-taking, and the potential impact on estimates if it does occur.
- Probability-based panels typically sample a panelist for one survey at a time and, unlike opt-in samples, do not use routers. This further limits the potential financial reward of infiltrating a probability-based panel.
This is not to say that opt-in samples should be entirely avoided. Sometimes, limited budgets and/or limited feasibility on probability-based panels mean that opt-in sample is the only feasible way to reach a target sample size. Opt-in sample providers take many measures to screen out bad actors, often developing their own AI tools to flag suspicious behavior. Still, as demonstrated by the research cited above, bogus respondents can sometimes overcome these front-end measures.
This means that, when opt-in sample is used, a multilayered anti-fraud strategy should include back-end review of the data to identify, remove, and replace suspicious respondents. But how exactly can we tell whether a respondent is suspicious? How do we avoid inadvertently deleting legitimate respondents? And can this process be automated, to limit manual review time that can blow up budgets and schedules?
This is where a parallel probability sample, combined with advanced machine learning techniques, can help.
Our Method: Isolation Forests Trained on a Parallel Probability Sample
Our method of detecting suspicious respondents relies on a machine learning algorithm called isolation forests. This is an unsupervised procedure, meaning that it does not require a dataset where known suspicious respondents are pre-identified. It is a multivariate outlier detection algorithm, meaning that it examines respondents’ answers to all survey items and identifies respondents providing unusual combinations of responses. Its output is a score on which lower values indicate greater “outlier-ness”.
When we have a survey that is administered to both an opt-in and a probability sample, we proceed as follows:
- We train an isolation forest model on the probability sample only.
- We use the resulting model to assign an outlier score to all respondents, both probability and opt-in.
- From the probability sample only, we calculate the 1st percentile of the isolation score.
- In the opt-in sample, respondents are flagged as suspicious if their scores fall below that threshold derived from the probability sample.
The intuition behind this approach is that, for any survey, there are inherent relationships between items that are likely to be reflected in legitimate responses. For example, a sincere respondent who says that vanilla is their favorite ice cream flavor should not later say that chocolate is their favorite flavor; someone who does might be responding randomly without reading the questions. Similarly, a respondent should not say “Yes” to multiple items asking about rare and independent characteristics; someone who does might be engaged in “satisficing” behavior in an attempt to screen into more surveys.
The practical challenge is that the expected relationships between items depend entirely on what items are asked in the survey. While we could manually determine the expected relationships, and write a program to flag divergences from those, it would be time- and labor-intensive to do this separately for each survey. But having a probability sample helps us take a shortcut.
Because probability samples are “secure by design” from large-scale fraud, we can use the probability sample to “learn” the expected patterns of responses for a given survey. That is, by giving a machine learning algorithm a sample that we expect to be mostly clean, we enable it to identify the response patterns that would be expected from a legitimate respondent and then flag opt-in responses that fall well outside these expected patterns. This is why we train the isolation forest on the probability sample.
Of course, since our goal is always to represent the entire population, there is some risk to removing respondents who provide unusual responses. For example, we do not want to exclude legitimate respondents who simply hold rare opinions. This is why we use a multivariate outlier measure, as we generally do not want to remove a respondent based on a single item (unless that item is specifically designed as an attention check). It is also why we flag only those opt-in respondents who fall outside the extreme bounds of the distribution observed in the probability sample; in this way, we aim to minimize the inadvertent removal of rare but legitimate response patterns.
Does this method work?
We recently ran a hybrid survey that included both a probability sample from the SSRS Opinion Panel and an opt-in sample. The opt-in vendor used their typical front-end quality control measures. This survey included many items that could be vulnerable to the types of errors identified in the recent Pew reports, for example, Yes/No items asking about rare characteristics or behaviors.
Figure 1 shows the percentage of opt-in respondents, compared to SSRS Opinion Panel respondents, who “fail” several data quality checks. The checks we consider are:
- Uncommon combination of income sources: this is similar to one of the checks used in the 2023 Pew report. Respondents fail this check if they report receiving all three of the following sources of income: worker’s compensation, Social Security, and Supplemental Nutrition Assistance (SNAP). Of course, a meaningful share of the population could honestly answer “Yes” to any one of these; but, according to the Census Bureau’s Current Population Survey, the true share of adults who receive all three is effectively zero.
- Sincerity check fail: the respondent said “Yes” to an item to which the true incidence should be zero.
- Attention check fail: the respondent gave the wrong answer to an attention check item.
- Speeding: the respondent’s length of interview was less than 30% of the median from the probability sample.
- Outlier Yes responses: the number of “Yes” responses to all Yes-No items on the survey was above the 99th percentile from the probability sample.
- Outlier isolation forest score: the respondent’s isolation forest score was below the 1st percentile from the probability sample, as described above.
- Fail any 2 checks: fail any 2 of the above checks.
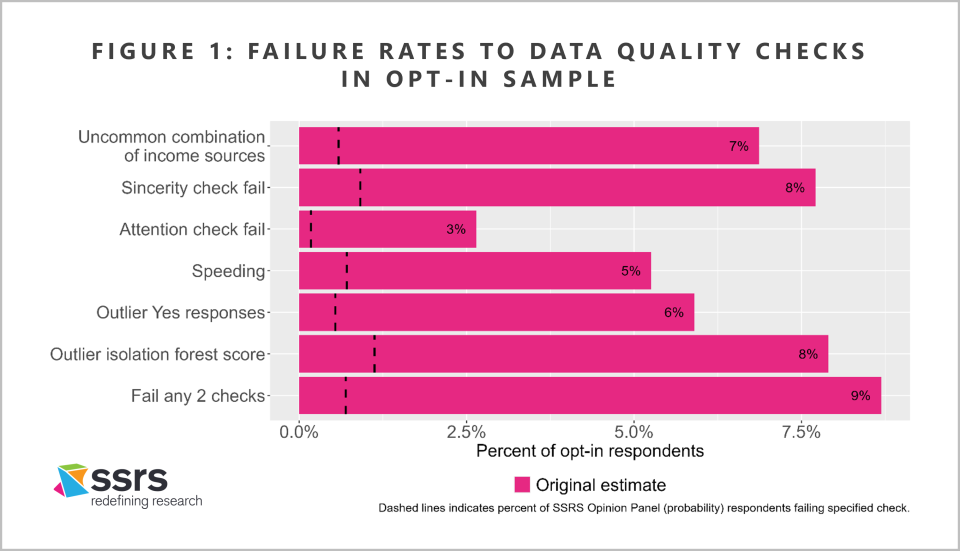
In the probability-based SSRS Opinion Panel sample, the failure rate for each of these checks is 1% or below. Failure rates are much higher in the opt-in sample, with nearly 9% of respondents failing 2 or more checks. In particular, about 7% of opt-in respondents report receiving worker’s compensation, Social Security, and SNAP; and for about 6%, the total number of “Yes” responses is well outside the norm from the probability sample. Thus, the opt-in sample exhibits significant positivity bias in Yes-No items, as highlighted in the 2023 Pew report.
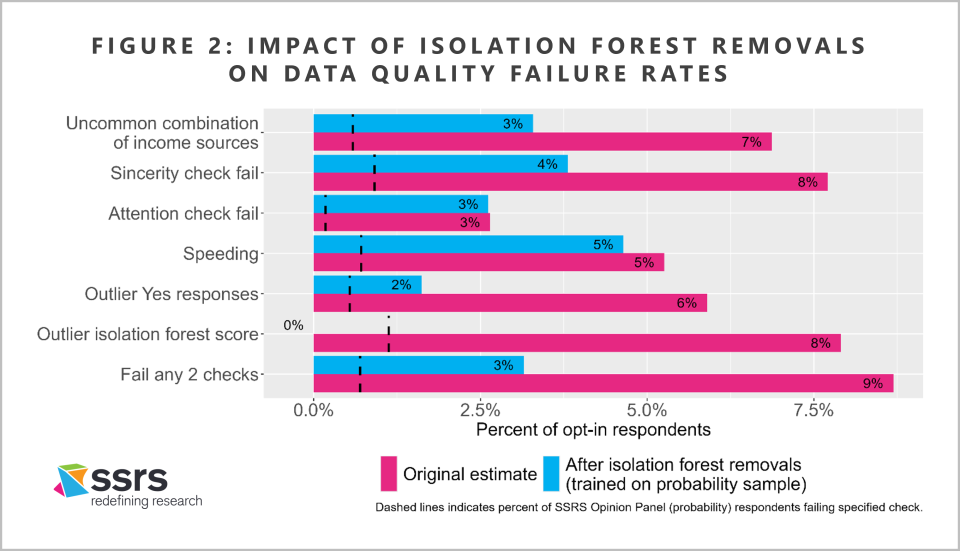
Figure 2 shows these same results after we use the isolation forest algorithm, trained on the SSRS Opinion Panel sample, to drop outlier respondents from the opt-in samples. Overall, this method dramatically reduces (though does not eliminate) the positivity bias in the opt-in sample. For example, the share of respondents reporting all three income sources falls to about 3%, and the share with an outlier total number of “Yes” responses falls to under 2%.
Do we need the probability sample?
What if we did not have a parallel probability sample for this survey? Could we have achieved similar results by training the isolation forest on the opt-in sample itself?
As it turns out, the probability sample is critical. As shown in Figure 3, an isolation forest trained on the opt-in sample alone has much less impact on our measures of data quality—particularly those that reflect the positivity bias highlighted in the Pew report.
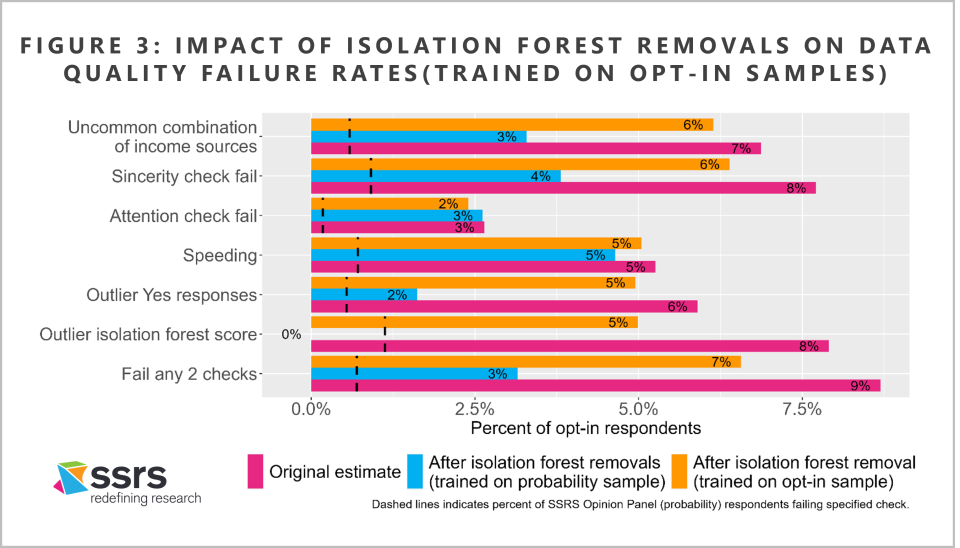
Clearly, the isolation forest algorithm is most effective when it can be trained on a parallel probability sample. If there are enough bogus respondents in an opt-in sample, then their response patterns may not actually look like outliers within that sample. It is important to have an independent sample source that is free of large-scale data quality problems in order to learn what legitimate response patterns look like for a given survey.
Conclusions
Based on these results, we are incorporating this isolation forest methodology into our Encipher® methodology for hybrid studies that blend probability and opt-in samples.
We continue to explore automated methods of identifying suspicious response patterns in opt-in-only samples. But, as these results demonstrate, a side-by-side probability sample dramatically improves our ability to enhance data quality by removing suspicious respondents on the back end.
It is important to note that, as shown in Figures 2 and 3, the isolation forest methodology does not entirely align the opt-in sample with the probability sample, either on measures of data quality or on weighted substantive estimates. Back-end removal of suspicious respondents is only one part of a multifaceted strategy for protecting opt-in samples from fraud. Whenever opt-in sample is used, it is important to work with vendors that recognize the risk of infiltration by bogus respondents, implement front-end measures to screen them out, and are transparent about their recruitment and data cleaning procedures.
Download the Report