The World Health Organization estimates that air pollution causes seven million premature deaths each year[1]. Despite its impact, awareness and concern about air quality vary widely among the public.
A recent SSRS study used an innovative approach to explore how people perceive the quality of the air they breathe. First, using the SSRS Opinion Panel Omnibus, Americans were surveyed about the air quality in their communities. Topics included levels of concern surrounding air pollution, awareness of pollution sources, and how their local air quality compares to the rest of the country.
Then, using the most recent quarter of the Environmental Protection Agency’s (EPA) Air Quality Index (AQI)[2], SSRS appended individual responses with air quality data from respondents’ specific locations for the previous year. The combination of opinion and empirical data creates a powerful foundation for shaping more targeted policies and impactful public education campaigns. When perception and reality are examined side by side, decision-makers can gain clearer insight into not just what communities are experiencing, but how residents are understanding and responding to those experiences.
Key Findings
Many believe their air quality is good—which often aligns with the environmental data.
- 85% of Americans believe their air is better than or about the same as other parts of the country
- EPA data mainly supports that view; 71% had an average AQI in the “Good” category.
Peak pollution levels shape perception.
- People who experienced higher peak AQI readings, potentially due to a discrete event like a nearby wildfire, were significantly more likely to view their local air as worse than average
However, Air quality awareness is low among the general public.
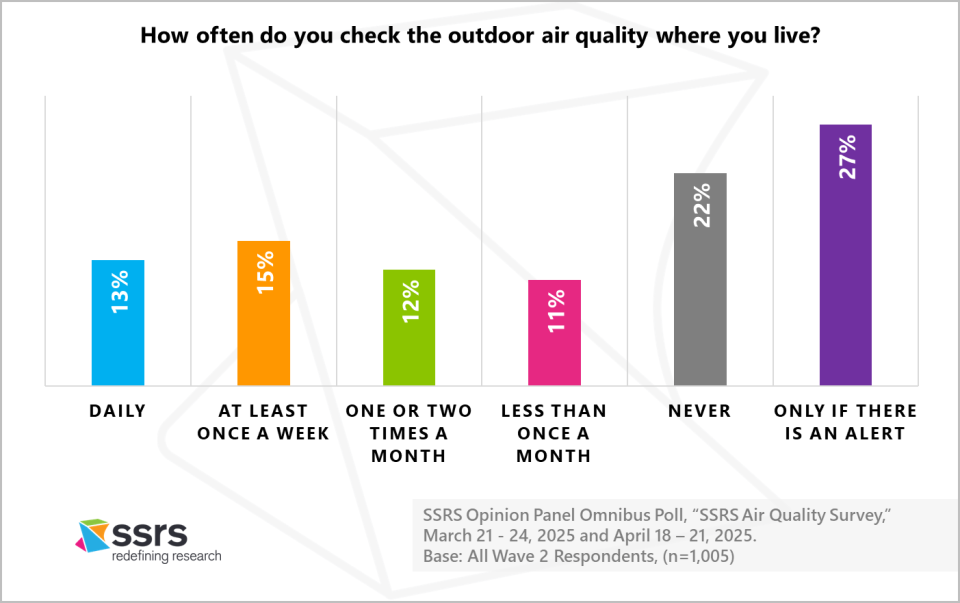
- 22% of Americans never check their local air quality
- 27% only check when there is an alert
- 13% check air quality daily
Personal health influences concern and behavior.
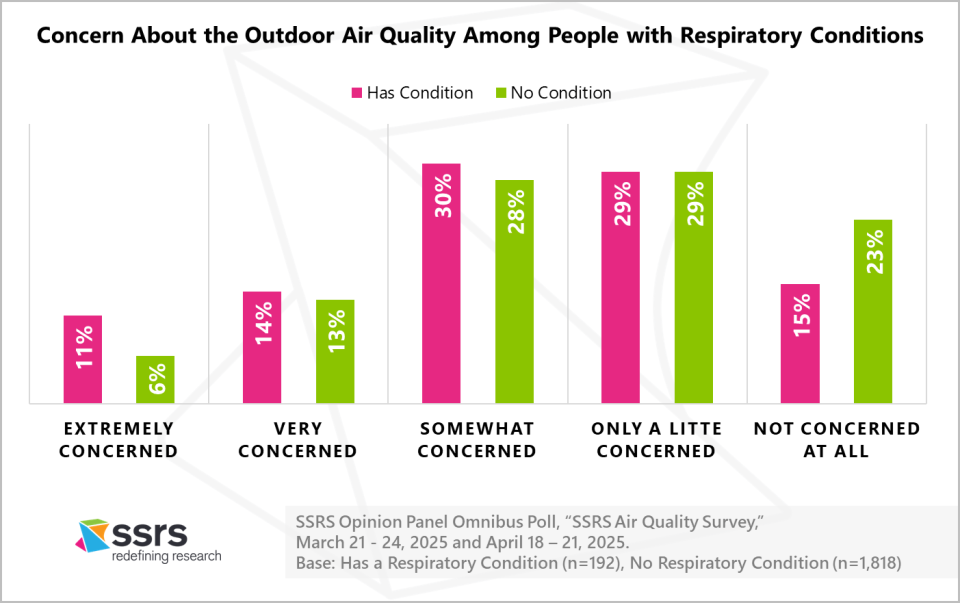
- Individuals with respiratory conditions are more likely to be concerned (55% are at least somewhat concerned compared with 47% among those who do not have a respiratory condition)
- Those with respiratory conditions are also more likely to monitor air quality daily (19% compared to 13% for other adults) and are more often found living in areas with cleaner air (76% had an average AQI of ‘good’ compared to 70% of other adults).
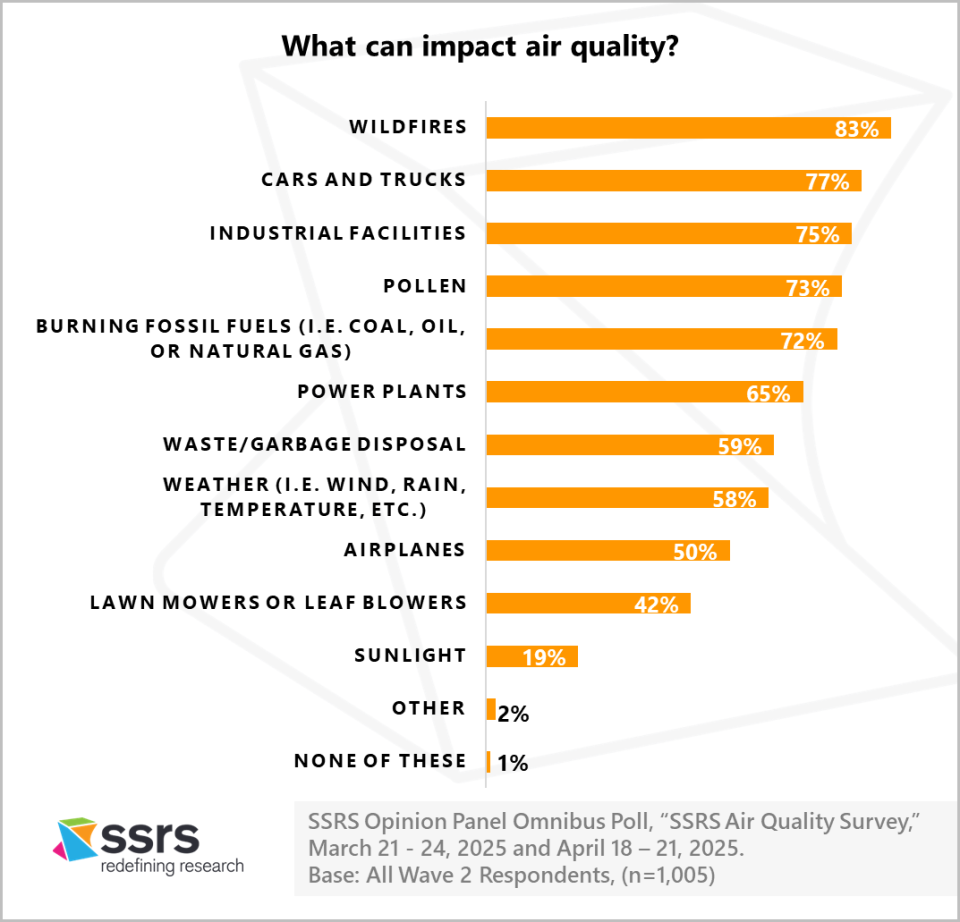
Public understanding of pollution sources is broad but not complete. The most cited contributors to poor air quality are:
- Wildfires (83%)
- Cars and trucks (77%)
- Industrial facilities (75%)
- Less visible factors like weather (58%) and sunlight (19%) are underrecognized despite their roles in shaping air pollution patterns
The Reality of Outdoor Air Quality
The AQI is the EPA’s tool for communicating air quality. Merging this data with opinions about air quality gathered from the SSRS Opinion Panel Omnibus creates a comprehensive picture of what Americans are experiencing, perceiving, and understanding about their outdoor air quality.
Public Perception of Outdoor Air Quality Correlates with Peak AQI
Most U.S. adults have a positive opinion of their outdoor air quality. Nearly half of Americans (45%) believe the air where they live is better than in most other places in the country, while another 41% think it’s about the same. Only 14% believe their air quality is worse than elsewhere in the U.S.
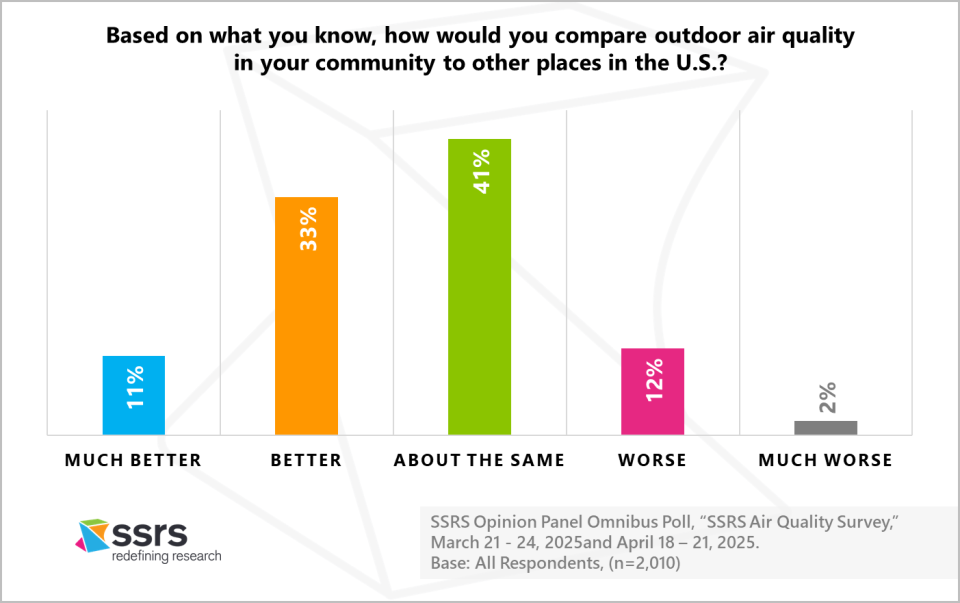
These perceptions track with the EPA’s AQI. Using the most recent quarterly data prior to the survey, Q2 2024, to calculate the average AQI across each pollutant of AQI, 71% of respondents fall into the EPA’s good rating. Twenty-eight percent are in the moderate category, while one percent are in the unhealthy for sensitive groups, and 0.3% are in the unhealthy category.[3]
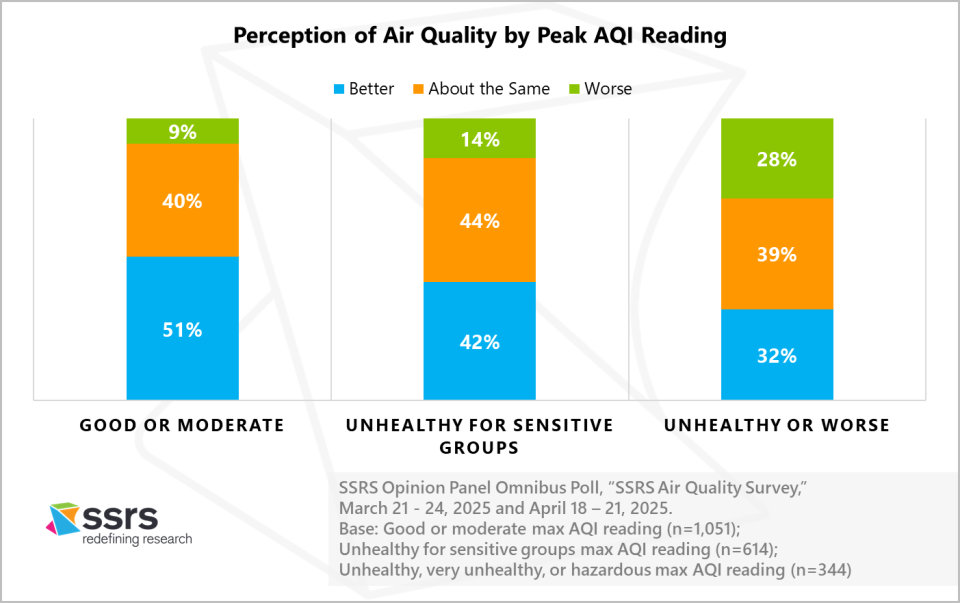
Because air quality can be significantly impacted by a singular event such as wildfire, it’s important to look at the peak AQI readings a respondent experienced prior to the survey, i.e., the reading on the day with the worst air quality during the quarter, in addition to average AQI. About half of respondents had a max AQI reading in the moderate category, 31% in the unhealthy for sensitive groups category, 15% in the unhealthy category, and 3% in the very unhealthy category. One respondent had a max AQI reading in the Hazardous category.
Among those with a maximum AQI reading in the unhealthy or worse categories, 28% say their air was worse than in other parts of the country. By contrast, only 9% of those with a peak reading in the moderate category and 14% in the unhealthy for sensitive groups range say the same.
Americans Express Low Levels of Concern About Air Quality
Air quality is not a major focus for most Americans. About half report that they either never check the air quality where they live (22%) or only do so when there is an alert (27%). Another quarter say they check it infrequently—once a month or less often (23%). Only 13% of respondents say they check their outdoor air quality daily, while 15% check it at least once a week.
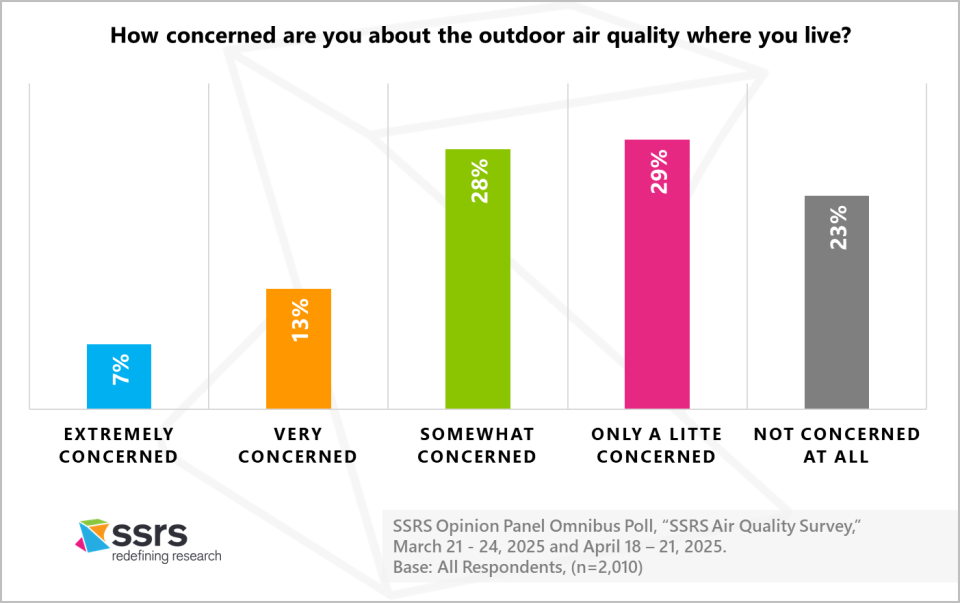
Concern about local air quality follows a similar pattern of low engagement. Half of Americans say they are only a little concerned (29%) or not at all concerned (23%) about the outdoor air quality where they live, and only one in five say they are extremely (7%) or very (13%) concerned about their air quality.
Surprisingly, for the population, both attention to and concern about air quality are not strongly correlated with a respondent’s actual air quality in the months prior to the survey.
Personal Health Influences Concern and Behavior
While outdoor air quality affects everyone, individuals with respiratory or other breathing-related health conditions are more vulnerable to its impacts than others. Among this higher-risk group, 11% say they are extremely concerned about the outdoor air quality where they live.
This population also tends to be more engaged and proactive in monitoring air quality. Nearly one in five report checking their outdoor air quality daily (19%), with another 18% saying they check it at least once a week. Meanwhile, only 13% of those without these conditions say they check their outdoor air quality daily, and 15% check it at least once a week.
These heightened concerns may be shaping decisions about where to live. Individuals with respiratory conditions are slightly more likely than others to reside in areas with better average air quality, as reflected by a higher likelihood (76% v. 70%) of having an AQI in the “good” category. They are also more likely to have experienced a peak AQI in the “moderate” range as opposed to the more serious unhealthy or hazardous ranges.
Public Understanding of Pollution Sources is Broad but not Complete
According to the U.S. Environmental Protection Agency (EPA), outdoor air quality is shaped by a complex interplay of emissions, chemical reactions, and environmental conditions [4] . When people are asked about the sources of pollution in the air around them, their answers reveal environmental awareness and a focus on the pollutants most visible in their daily lives. The public tends to recognize visible or high-impact events (e.g., smoke, traffic, factories), but underestimates less visible systemic contributors (e.g., meteorology, sunlight-driven chemical reactions). The top five factors people believe impact outdoor air quality are wildfires (83%), cars and trucks (77%), industrial facilities (75%), pollen (73%), and the burning of fossil fuels (72%). Notably, weather (58%) and sunlight (19%) appeared lower in the list of perceived air quality influences. In reality, weather conditions such as wind, temperature, and humidity play a major role in how pollutants travel and settle.
Conclusion
This SSRS Opinion Panel Omnibus study offers a comprehensive look into how Americans perceive their air quality and how it aligns with the actual conditions they experience.
Our unique integration of survey responses with objective EPA AQI data provides an insightful blend of public opinion and environmental reality. This fusion allows us to paint a clearer picture of the true air quality conditions across the country while highlighting the limited engagement most Americans have with monitoring air quality on a regular basis.
Although people generally have an accurate understanding of the air they breathe, there are areas for further education, particularly around lesser-recognized factors such as weather and sunlight, which play a critical role in air pollution patterns.
This research illustrates the value of connecting public perception with empirical data, offering a foundation for shaping policies and education campaigns that effectively address air quality concerns. As organizations and policymakers work to combat air pollution and other issues, partnering with SSRS can provide invaluable insights.
[1] https://www.who.int/health-topics/air-pollution#tab=tab_1
[2] https://www.epa.gov/outdoor-air-quality-data
[3] EPA AQI categorizes: 0-50 as Good, 51-100 as Moderate, 101-150 as Unhealthy for Sensitive Groups, 151-200 as Unhealthy, 201-300 as Very Unhealthy, 301+ as Hazardous.
[4] https://www.who.int/health-topics/air-pollution#tab=tab_
Methodology
This study was conducted by SSRS on its Opinion Panel Omnibus platform. The SSRS Opinion Panel Omnibus is a national, twice-per-month, probability-based survey. Data collection was conducted from March 21 – March 24, 2025, among a sample of 1,005 respondents and from April 18 – April 21, 2025 among an additional sample of 1,005 respondents. Each wave was conducted via web (n=975) and telephone (n=30) and administered in English. The margin of error for total respondents is +/-3.7 percentage points at the 95% confidence level. The design effect is 1.43. All SSRS Opinion Panel Omnibus data are weighted to represent the target population of U.S. adults ages 18 or older. View the questions used for this analysis, along with the responses >>
The SSRS Opinion Panel Omnibus is conducted on the SSRS Opinion Panel. SSRS Opinion Panel members are recruited randomly based primarily on a nationally representative ABS (Address Based Sample) design (including Hawaii and Alaska). ABS respondents are randomly sampled by Marketing Systems Group (MSG) through the U.S. Postal Service’s Computerized Delivery Sequence File (CDS), a regularly updated listing of all known addresses in the U.S. For the SSRS Opinion Panel, known business addresses are excluded from the sample frame. Additional panelists are recruited via random digit dial (RDD) telephone sample of cell phone numbers connected to a prepaid cell phone. This sample is selected by MSG from the cell phone RDD frame using a flag that identifies prepaid numbers. Prepaid cell numbers are associated with cell phones that are “pay as you go” and do not require a contract.
The SSRS Opinion Panel is a multi-mode panel (web and phone). Most panelists take self-administered web surveys; however, the option to take surveys conducted by a live telephone interviewer is available to those who do not use the internet as well as those who use the internet but are reluctant to take surveys online.
About the Air Quality Index (AQI)
The AQI is divided into six categories that correspond to different levels of health concern. For ease of use, the categories are color-coded and provide statements about local air quality, which groups of people may be affected, and steps people can take to reduce their exposure to air pollution. The AQI is also used as the basis for air quality forecasts and current air quality reporting.
Calculation of average AQI: First, we calculate the average/max/etc. daily AQI based on each tracked pollutant (Ozone, CO, etc.) per measurement site. Then, the closest measurement site, based on latitude & longitude, per pollutant, is linked to each panelist. Finally, each final statistic (average, max, min) is the maximum of that statistic across the pollutants per panelist – so if the average daily AQI from Ozone was 35, particulate matter was 37, CO was 51, NO2 was 48, and SO2 was 45, the final average daily AQI for that panelist would be the maximum of those values, 51.
Highest AQI: The highest daily reading during the measurement period.
References
US Environmental Protection Agency. Air Quality System Data Mart [internet database] available via https://www.epa.gov/outdoor-air-quality-data. Accessed April 20, 2025.
World Health Organization. (2021). Air pollution. https://www.who.int/health-topics/air-pollution#tab=tab_1
U.S. Environmental Protection Agency. (2023a). Criteria Air Pollutants. https://www.epa.gov/criteria-air-pollutants
U.S. Environmental Protection Agency. (2023b). Outdoor Air Quality. https://www.epa.gov/report-environment/outdoor-air-quality