Across kitchen tables, in grocery store aisles, and in late‑night conversations about “making it all work,” Americans are quietly rewriting the rules of their financial lives. Some are cutting back, others are digging out of debt, and many are simply trying to keep pace with rising costs. Yet beneath these individual decisions is a larger, collective question: How do people really feel about the economy right now, and what are they doing in response?
To find out, we turned to the SSRS Opinion Panel, one of the nation’s few probability‑based, nationally representative panels. Its methodological rigor gives us a uniquely accurate view into how Americans experience this economy in real time—what burdens them, what they’re prioritizing, and how their perceptions align (or don’t) with traditional economic indicators. The fifth wave was conducted in February 2026 and fielded using the SSRS Opinion Panel Omnibus, a nationally representative, probability-based survey of U.S. adults.
What we uncovered is a story of contrasts. Even as the majority of Americans rate the economy as “bad,” many report their own finances as “good” or at least manageable. People are tightening their spending, tackling debt, and adjusting expectations, all while managing rising pressures from groceries, housing, utilities, and credit card debt. And this isn’t a single shared experience—Millennials, Boomers, and Gen Z are navigating very different financial realities, just as class identity is shaping stark divides in outlook and opportunity.
In a moment this complex, organizations need more than headlines, they need clarity. Our research offers a grounded, human view of how economic strain is reshaping priorities and behaviors, and what that means for leaders trying to understand the markets, communities, and consumers they serve.
Note: All findings in this report reflect data collected before the outbreak of the war in Iran. As a result, the insights represent Americans’ economic attitudes and financial behaviors prior to this new period of geopolitical uncertainty.
Americans Are Still Down on the Economy—But Their Personal Finances Tell a More Nuanced Story
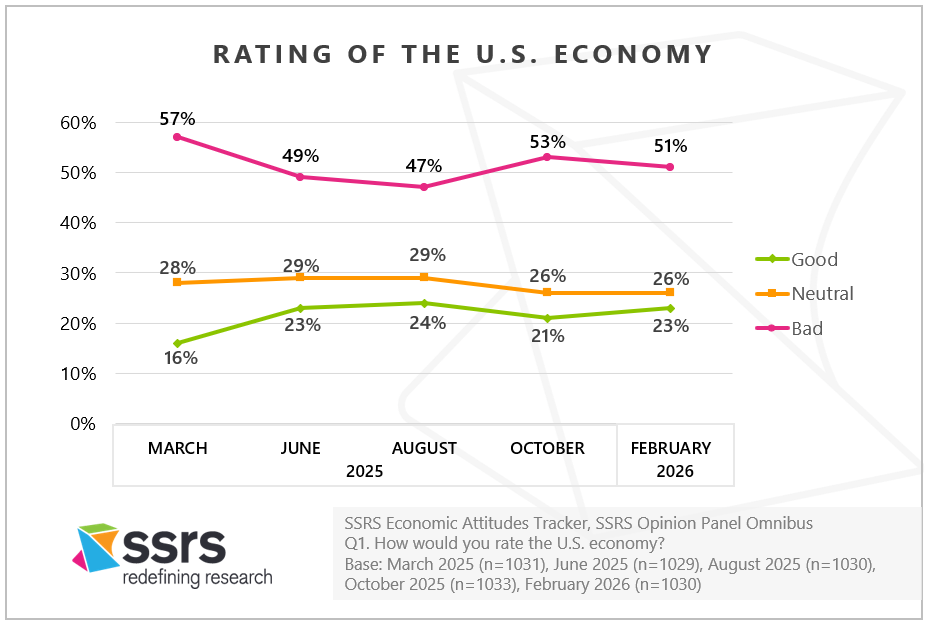
Most Americans continue to feel negatively about the economy. In our recent survey, 51% rate the U.S. economy as “bad,” compared with only 23% who call it “good”—a pattern that has shown little change over the past year.
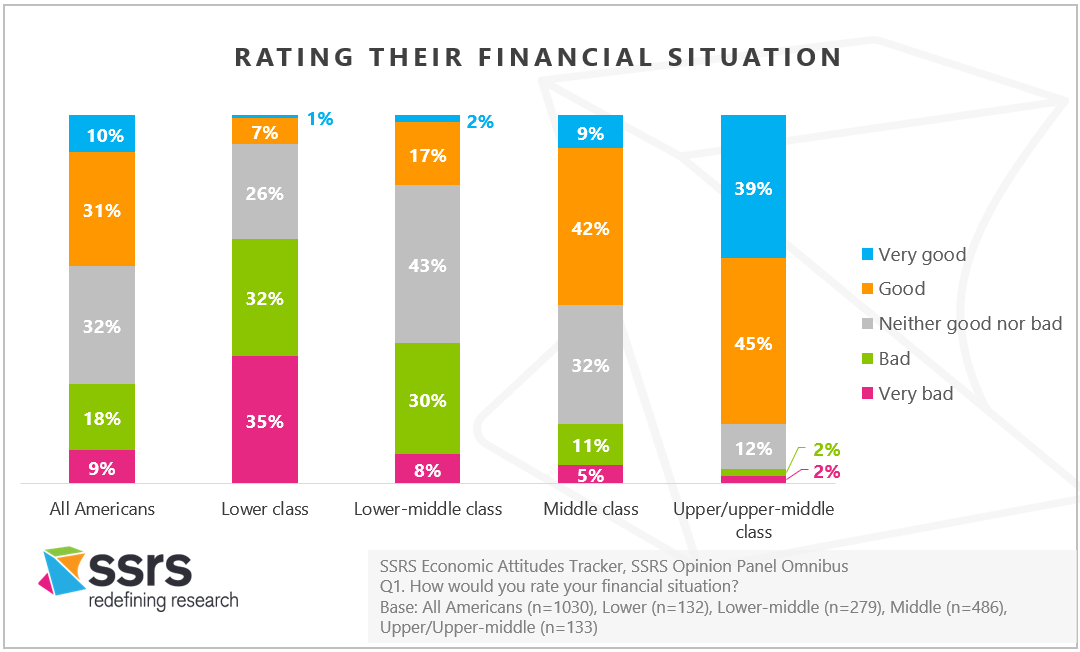
Yet when people assess their own financial situation, the story becomes more complicated. About three in ten Americans (31%) say their personal finances are “good,” another third (32%) place themselves squarely in the “neither good nor bad” category, and 18% say their finances are “bad.” Just 10% rate their financial situation as “very good,” while 9% place themselves at the “very bad” end of the spectrum.
Class Identity Shapes the Financial Experience
Perceptions diverge sharply across social class.
Those who self‑identify as lower class are feeling real financial strain—32% rate their personal finances as “bad,” and an additional 35% say “very bad.” Lower‑middle‑class Americans also express concern: they most commonly describe their finances as “neither good nor bad” (43%) or “bad” (30%).
At the other end of the economic ladder, upper‑middle and upper‑class Americans are the only groups clearly thriving. A striking 39% say their finances are “very good,” and 45% rate them as “good,” underscoring a widening perception gap in how Americans experience this economy.
How Americans Are Adjusting Their Financial Priorities
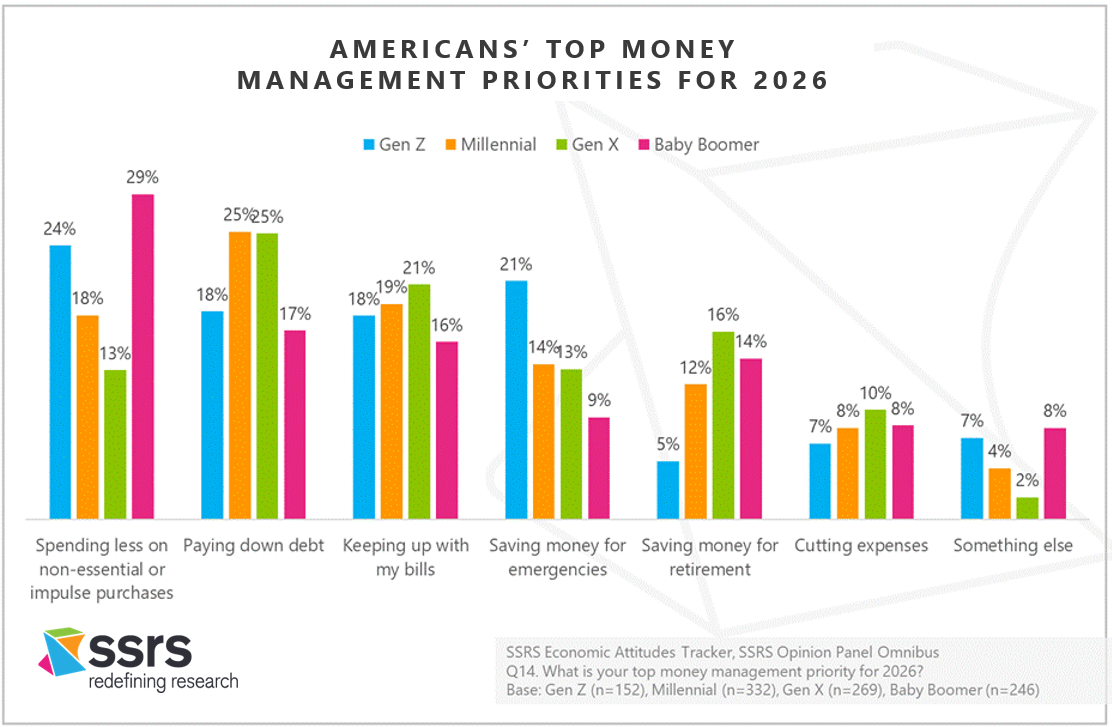
In today’s economic climate, Americans are making clear, practical shifts in how they prioritize their financial demands. The most common response is to cut back: 21% are spending less on non‑essentials or impulse purchases, and another 21% are prioritizing paying down debt. Nearly as many—19%—say their primary focus is simply keeping up with bills. Longer‑term strategies remain in play, though with smaller shares. Thirteen percent are saving for emergencies, 12% are saving for retirement, and 8% are looking for expenses to trim.
These priorities vary significantly by generation. Gen Z and Baby Boomers are the most likely to tighten their discretionary spending (24% and 29%, respectively). Millennials and Gen X, meanwhile, are in debt‑reduction mode, with 25% in each generation identifying paying down debt as their top priority. Gen Z stands out for emphasizing emergency savings (21%), while Gen X is more inclined to focus on retirement savings (16%).
Class identity also shapes financial behavior in notable ways. Those who identify as lower or lower‑middle class are far more focused on the basics: 33% of the lower class and 26% of the lower‑middle class say keeping up with bills is their top financial priority. That compares sharply with 14% of the middle class and just 5% of the upper‑middle and upper classes. Conversely, members of the upper‑middle and upper classes are much more likely to be prioritizing retirement savings (29%), compared with 13% of the middle class, 7% of the lower‑middle class, and 5% of the lower class.
What’s Draining Household Budgets?
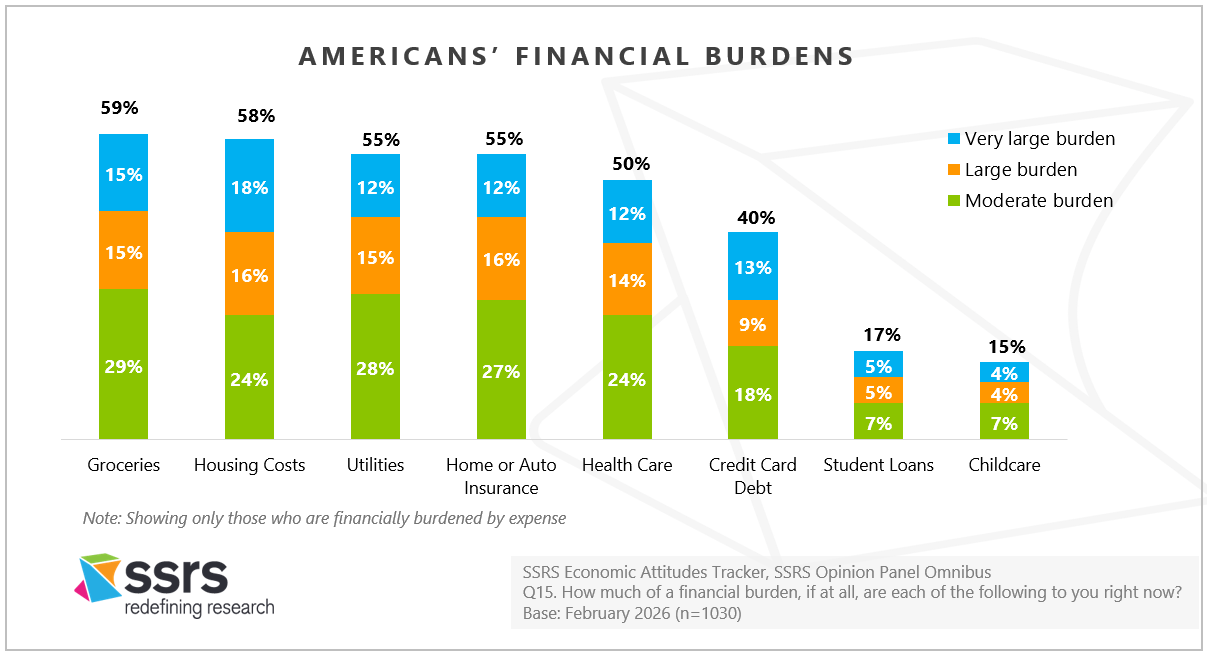
When asked which expenses are weighing most heavily, Americans point squarely to the essentials: Groceries (59%) and housing (58%). These top the list of moderate to very large financial burdens. Close behind are utilities (55%) and home or auto insurance (55%)
Credit card debt is also a meaningful source of strain, with 40% reporting it a moderate to very large burden. The credit card debt pressure is especially acute for Gen X (51%), parents (50%), Black Americans (59%), and Hispanic Americans (56%).
The Composite Financial Burden: A Nation Split
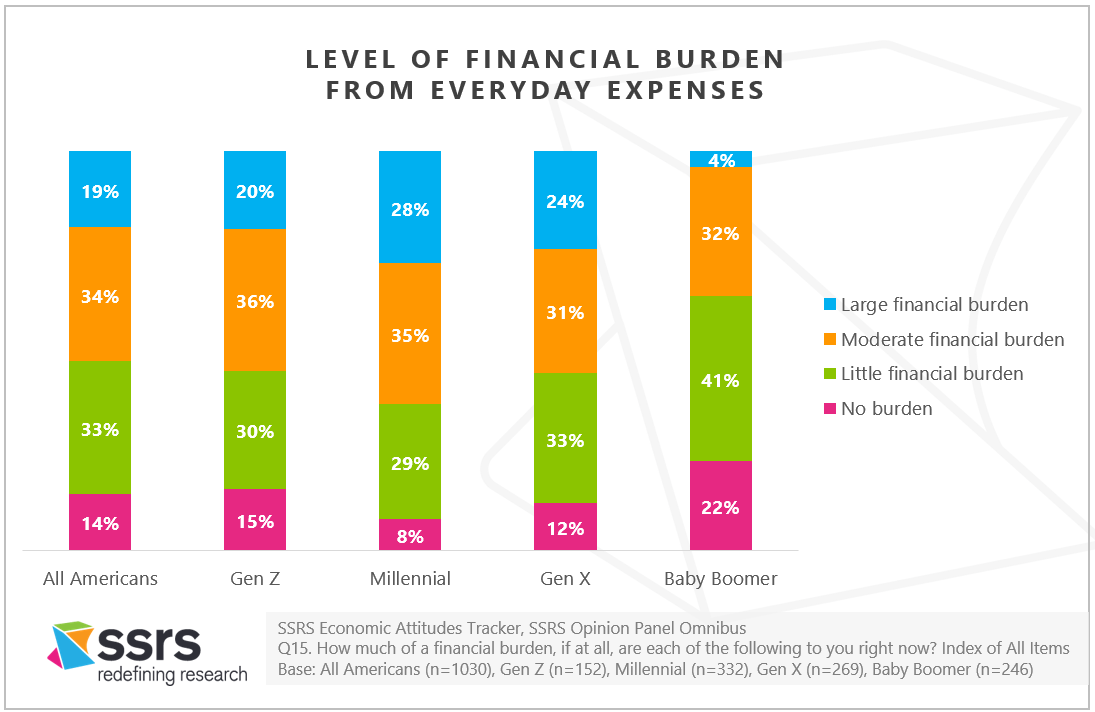
When these everyday expenses are indexed together, Americans divide almost evenly between feeling little to no strain and feeling moderate to large strain:
- 14% feel no burden
- 34% feel a little
- 33% feel a moderate burden
- 19% feel a large burden
On the surface, many Americans feel stable—41% say their finances are “good,” even as about three in ten say theirs are “bad” (27%). But underneath that self‑assessment lies a more challenging reality: 52% report that everyday expenses pose a moderate or large burden. The result is a quiet tension between how financially secure people feel and how stretched they actually are by rising costs.
These averages also conceal major generational differences.
Millennials are feeling the most financially burdened right now.
About three in ten Millennials feel like their everyday expenses are a large financial burden (28%). Gen X and Gen Z are also feeling squeezed, with 24% of Gen X and 20% of Gen Z reporting a large burden. Meanwhile, Baby Boomers are faring comparatively well—22% feel no burden at all, and 41% feel only a little.
Other groups carrying large everyday financial burdens include parents (36%), Black Americans (31%), Hispanic Americans (31%), and those identifying as lower class (28%).
In Summary
Americans’ financial priorities, pressures, and perceptions paint a picture of a country navigating uncertainty with both caution and resilience. Even as many households feel the squeeze of everyday expenses and continue to view the national economy negatively, people are making deliberate, pragmatic choices to regain control of their financial lives. The divergence across generations and social classes underscores just how uneven this economic moment is—and why organizations need trustworthy, nuanced data to understand how consumers are truly coping and adapting.
At a time when the signals are complex and the stakes are high, our work helps leaders cut through the noise. With rigorous, nationally representative insights from our Opinion Panel, we help organizations decode emerging trends, anticipate shifts in consumer behavior, and make decisions grounded in reality rather than assumption.
Methodology
The Economic Attitudes Tracker is conducted by SSRS on its Opinion Panel Omnibus platform. The SSRS Opinion Panel Omnibus is a national, twice-per-month, probability-based survey.
Economic Attitudes Tracker waves include:
- March 21 – March 24, 2025, among a sample of 1,031 panelists. The survey was conducted via web (n=1,001) and telephone (n=30) and administered in English (n=1,005) and Spanish (n=26). The margin of error for total respondents is +/-3.8 percentage points at the 95% confidence level. The design effect is 1.54.
- June 6 – June 10, 2025, among a sample of 1,029 respondents. The survey was conducted via web (n=999) and telephone (n=30) and administered in English (n=1,004) and Spanish (n=25). The margin of error for total respondents is +/-3.5 percentage points at the 95% confidence level. The design effect is 1.29.
- August 1 – August 4, 2025, among a sample of 1,030 respondents. The survey was conducted via web (n=1,000) and telephone (n=30) and administered in English (n=1,004) and Spanish (n=26). The margin of error for total respondents is +/-3.5 percentage points at the 95% confidence level. The total sample design effect for this survey is 1.31.
- October 16 – October 19, 2025, among a sample of 1,033 respondents. The survey was conducted via web (n=1,003) and telephone (n=30) and administered in English (n=1,007) and Spanish (n=26). The margin of error for total respondents is +/-3.5 percentage points at the 95% confidence level. The total sample design effect for this survey is 1.34. SSRS recontacted five respondents from the Omnibus survey to invite them to participate in a qualitative in-depth follow-up interview. Each interview lasted 30-minutes and was conducted over Zoom with an SSRS researcher between October 28 – 30, 2025.
- February 5 – February 9, 2026, among a sample of 1,030 respondents. The survey was conducted via web (n=1,000) and telephone (n=30) and administered in English (n=1,004) and Spanish (n=26). The margin of error for total respondents is +/-3.4 percentage points at the 95% confidence level. The total sample design effect for this survey is 1.26.
All SSRS Opinion Panel Omnibus data are weighted to represent the target population of U.S. adults ages 18 or older.
The SSRS Opinion Panel Omnibus is conducted on the SSRS Opinion Panel. SSRS Opinion Panel members are recruited randomly based primarily on nationally representative ABS (Address Based Sample) design (including Hawaii and Alaska). ABS respondents are randomly sampled by Marketing Systems Group (MSG) through the U.S. Postal Service’s Computerized Delivery Sequence File (CDS), a regularly updated listing of all known addresses in the U.S. For the SSRS Opinion Panel, known business addresses are excluded from the sample frame. Additional panelists are recruited via random digit dial (RDD) telephone sample of cell phone numbers connected to a prepaid cell phone. This sample is selected by MSG from the cell phone RDD frame using a flag that identifies prepaid numbers. Prepaid cell numbers are associated with cell phones that are “pay as you go” and do not require a contract.
The SSRS Opinion Panel is a multi-mode panel (web and phone). Most panelists take self-administered web surveys; however, the option to take surveys conducted by a live telephone interviewer is available to those who do not use the internet as well as those who use the internet but are reluctant to take surveys online.