
A new SSRS Opinion Panel Omnibus poll finds that about three-fourths (76%) of U.S. adults report having ever spent money purchasing lottery tickets, making it the most common investment among eight types of speculative assets. About half have spent money gambling (51%), investing in individual stocks on the stock market (49%), and purchasing collectible items (49%).
These findings are part of an SSRS Opinion Panel Omnibus poll conducted September 5 – 8, 2025, among a nationally representative sample of 1,030 adults aged 18 and older.
On Which Speculative Assets Have U.S. Adults Spent Money?
In the new SSRS poll, U.S. adults were asked how recently, if ever, they had spent their money on a list of eight types of speculative assets. The poll found that about three-fourths (76%) of U.S. adults report having ever spent money purchasing lottery tickets, making it the most common investment from among the list. About half have spent money gambling, either in person or online (51%), investing in individual stocks on the stock market (49%), and purchasing collectible items, such as trading cards, sports memorabilia, comic books, or stamps (49%).
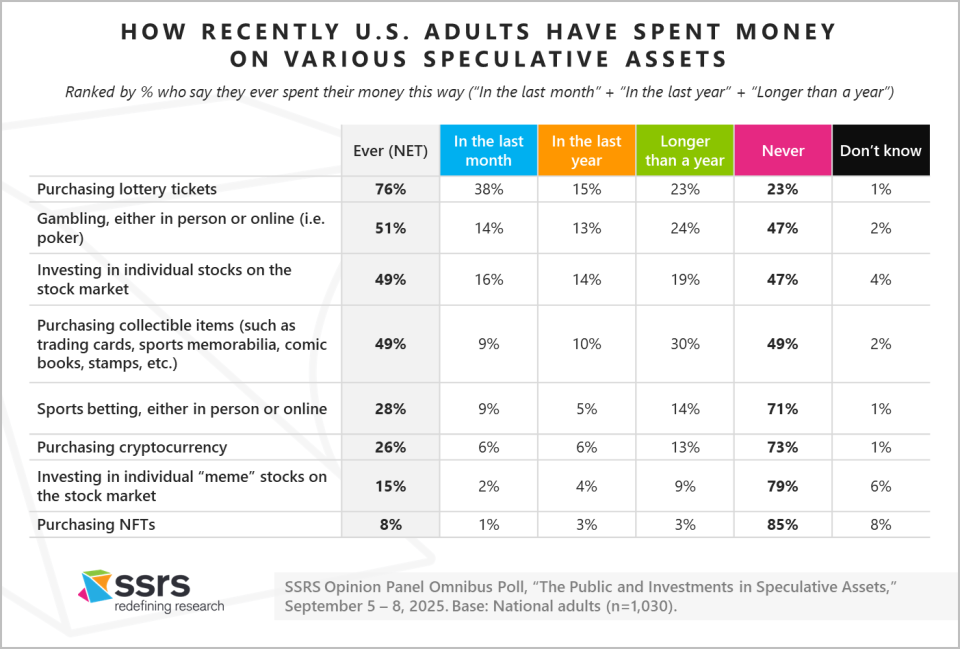
Fewer than three in ten U.S. adults have ever spent money on sports betting, either in person or online (28%) or purchasing cryptocurrency (26%), and fewer still reported having ever invested in individual “meme” stocks on the stock market (15%) or purchasing NFTs (8%).
In a more recent time frame, about half (53%) of U.S. adults say they have spent money in the past month or year on purchasing lottery tickets, 30% on investing in individual stocks, and 27% on gambling. Fewer than one in ten report having investing in individual “meme” stocks (6%) or NFTs (4%) in the past month or year.
How Does Investing in Speculative Assets Vary by Gender, Age, and Education?
Gender
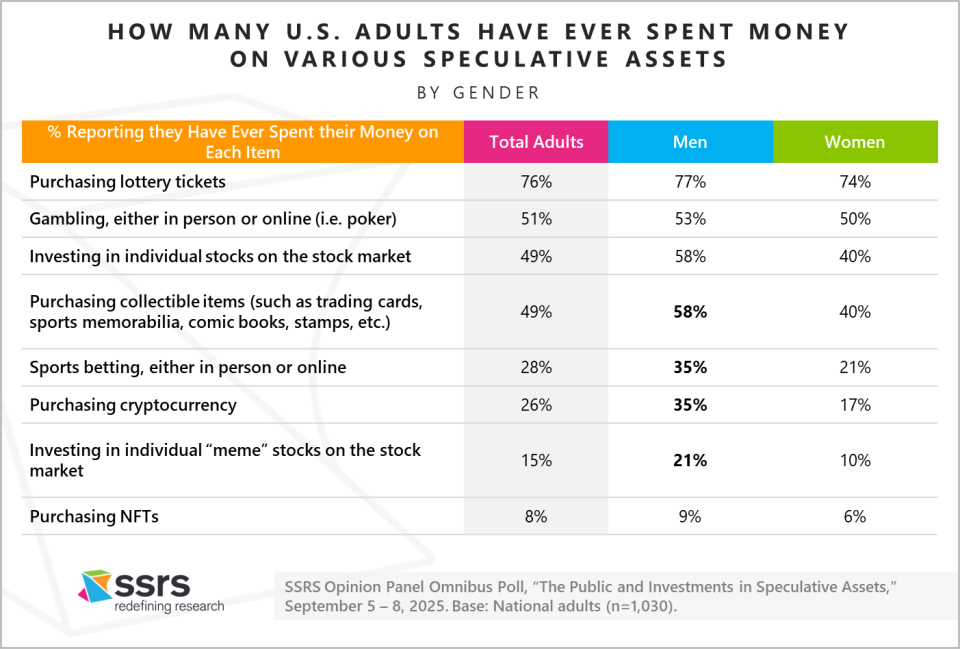
The proportion reporting ever having invested in various speculative assets varies considerably by gender, even though the top four types of spending are the same for both men and women. Men are significantly more likely than women to report ever having spent money investing in individual stocks (58% of men, 40% of women) and purchasing collectible items (again, 58% of men, 40% of women).
Men are also significantly more likely than women to report having spent money on sports betting (35% of men, 21% of women), purchasing cryptocurrency (35% of men, 17% of women), and investing in individual “meme” stocks (21% of men, 10% of women).
Age
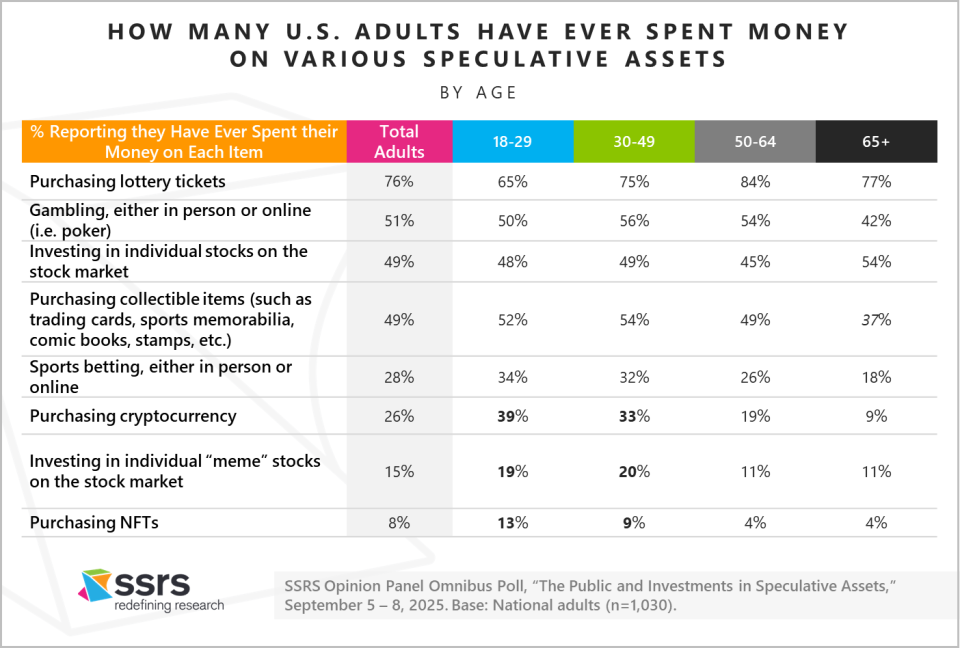
The proportion reporting ever having invested in various speculative assets also varies by age. The youngest age group (aged 18-29) is less likely than the three older age groups to report ever having purchased a lottery ticket (65% vs. more than three-fourths of the other age groups). When it comes to ever having spent money on gambling, those aged 30-49 (56%) and 50-64 (54%) are more likely than those aged 65 or over (42%) to report ever having done so. Adults aged 65 or over are also the least likely age group to report ever having purchased collectible items (37%).
Adults aged 18-49 are more likely than those aged 50 or over to report ever having spent money on sports betting (33% to 22%), purchasing cryptocurrency (35% to 15%), investing in “meme” stocks (19% to 11%), and purchasing NFTs (11% to 4%).
Education
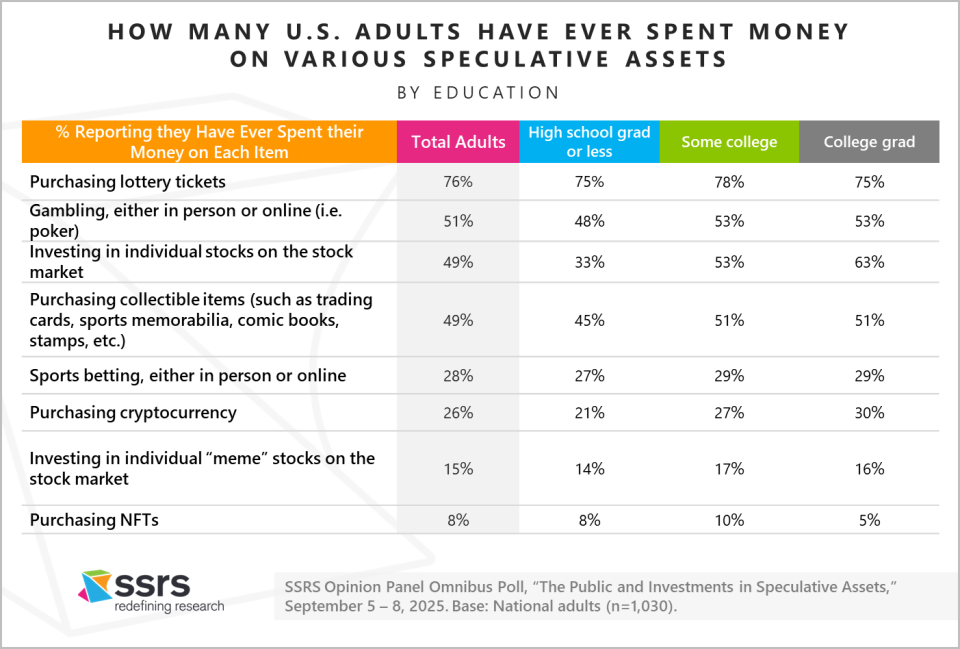
College graduates (63%) and those with some college education (53%) are more likely than those with a high school degree or less (33%) to report ever having ever invested in individual stocks. College graduates (30%) are also more likely than those with a high school degree or less (21%) to report ever having purchased cryptocurrency.
Methodology
Interviews for this study were conducted on the SSRS Opinion Panel Omnibus on September 5 – 8, 2025, among a nationally representative sample of 1,030 respondents aged 18 and older. The margin of error for total respondents is +/-3.4 percentage points at the 95% confidence level. The design effect is 1.27.
The SSRS Opinion Panel Omnibus is a multi-client, probability-based survey that fields twice a month. It delivers a nationally representative sample of 1,000 adults aged 18 or older in English (with Spanish language option). Data collection is conducted online and via phone (for non-internet and web-reluctant respondents) using the probability-based SSRS Opinion Panel.
All SSRS Opinion Panel Omnibus data are weighted to represent the target population of U.S. adults ages 18 or older. View the questions used for this analysis, along with the responses (topline).\
The SSRS Opinion Panel Omnibus is conducted on the SSRS Opinion Panel. SSRS Opinion Panel members are recruited randomly based on a nationally representative ABS (Address Based Sample) design (including Hawaii and Alaska). ABS respondents are randomly sampled by Marketing Systems Group (MSG) through the U.S. Postal Service’s Computerized Delivery Sequence File (CDS), a regularly updated listing of all known addresses in the U.S. For the SSRS Opinion Panel, known business addresses are excluded from the sample frame.
The SSRS Opinion Panel is a multi-mode panel (web and phone). Most panelists take self-administered web surveys; however, the option to take surveys conducted by a live telephone interviewer is available to those who do not use the internet as well as those who use the internet but are reluctant to take surveys online. All sample drawn for this study were SSRS Opinion Panelists who are U.S. adults ages 18 or older. Sample was selected to ensure representation by age, gender, race and ethnicity, education, Census region, and party identification. Possible sources of non-sampling error include non-response bias, as well as question wording and ordering effects.