New research from SSRS, conducted before the federal income tax filing deadline, finds that as of 10 days before the deadline, one-third of those who said they needed to file a return had not yet done so.
- This included 29% who said they planned to file by the deadline, and
- 5% who said they would apply for an extension.
These findings are part of an SSRS Opinion Panel Omnibus poll conducted , March 15–18 and April 5–7, 2024, among a nationally representative sample of 2,012 adults aged 18 and older.
Income Tax Return Filing Dates

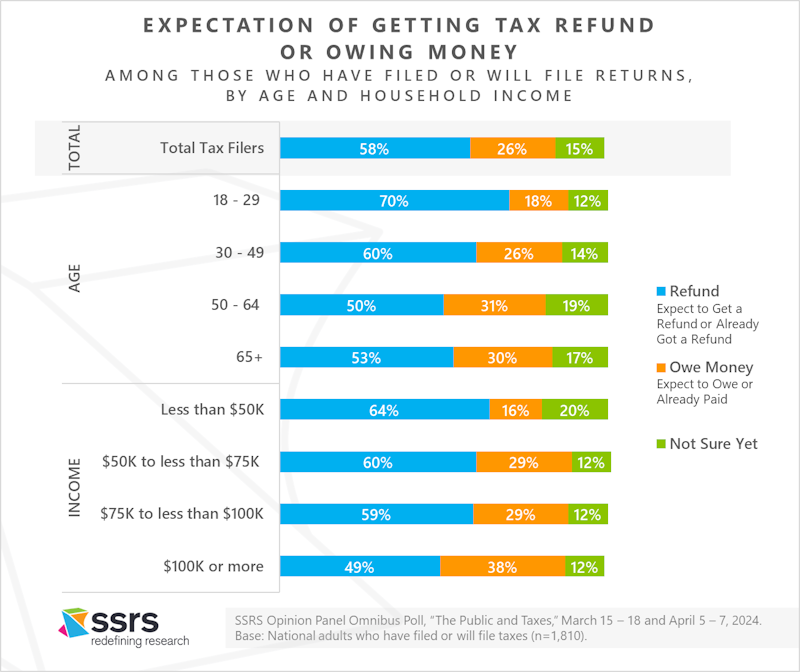
Expectations of a Tax Refund
Among those who had filed or said they would file a return, 58% had already received or expected to get a refund. About one in four (26%) said they expected to owe money or had already paid. Fifteen percent were not sure whether or not they would receive a refund. Filers aged 18-29 (70%) and 30-49 (60%) were significantly more likely than older adults to expect a refund. Filers with household incomes of $100,000 a year or more were more likely than all other income groups to believe they would owe money (38%); but even among this higher-income group, more people expected to get a refund (49%) than to owe money.
Those Who Expect a Refund File Their Tax Returns Earlier
Filers who had received or expected to receive a tax refund were significantly more likely to have filed their returns as of 10 days before the deadline (82%) than those who had already paid or expected to owe money (48%). More than half of those who expected to owe money had not yet filed, including 43% expecting to file by the deadline and 10% to apply for an extension.


Online Tax Software Is a Popular Way to File
When tax filers were asked how they had prepared or would prepare and file their returns, the most popular choice was using online tax software like TurboTax (42%), followed by using an accountant (31%). Online tax software was especially popular among filers age 18-29 and 30-49 (45% each) and among those with some college (46%) or college degrees (48%). Use of an accountant was most common among filers aged 65 or over (38%).

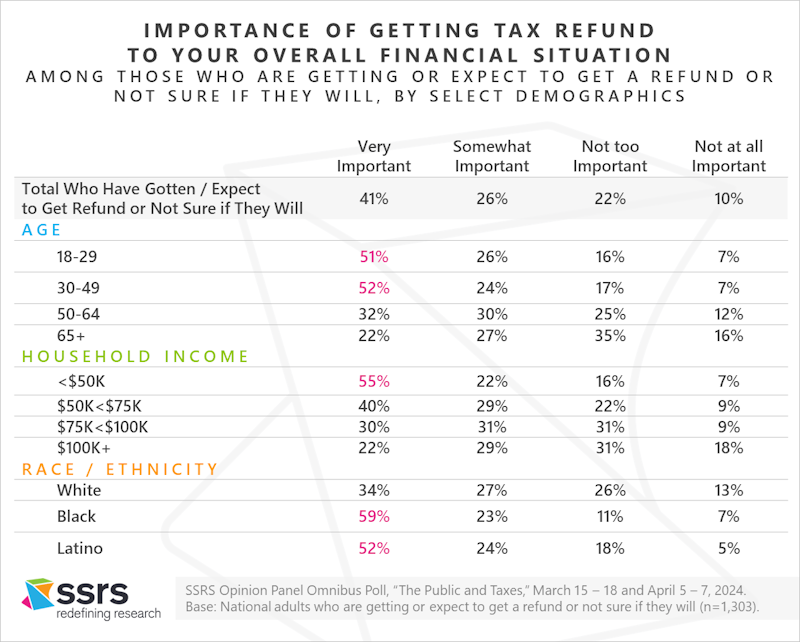
Tax Refunds Are Especially Important to Younger, Lower-Income, and Minority Filers
Two-thirds of those who had received or expected to receive a tax refund said the refund was very important (41%) or somewhat important (26%) to their overall financial situation. More than half of those aged 18-29 (51%) or 30-49 (52%) and with household incomes under $50,000 a year (55%), as well as Blacks (59%) and Latinos (52%) reported that their tax refund was very important.
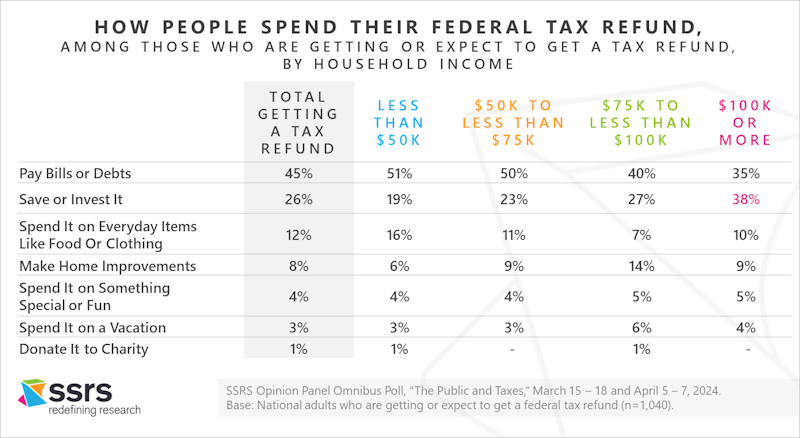
Those Expecting a Tax Refund Are Most Likely to Use It to Pay Bills or Debts
Nearly half of those who had received or expected to receive a refund planned to use it to pay bills or debts (45%). About one in four (26%) said they would save or invest it. Those with household incomes of $100,000 a year or more were the group most likely to say they would save or invest the refund (38%).
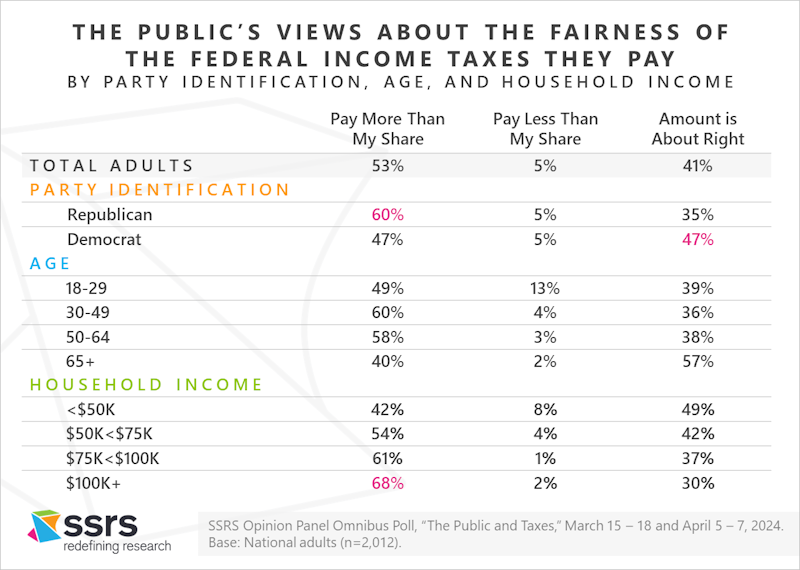
Slightly More Than Half of U.S. Adults Believe They Pay More Than Their Fair Share in Federal Income Taxes
Slightly more than half of U.S. adults (53%) believe they pay more than their fair share in federal income taxes. Nearly as many believe the amount is about right (41%) or that they pay less than their fair share (5%). Republicans (60%) are significantly more likely than Democrats (47%) to believe they pay more than their fair share. Adults aged 30-49 (60%) and 50-64 (58%) are more likely than younger or older adults to believe they pay more than their fair share. About two-thirds (68%) of adults with household incomes of $100,000 a year or more think they pay more than their fair share.
Methodology
These findings are part of an SSRS Opinion Panel Omnibus poll conducted March 15 – 18 and April 5–7, 2024, among a nationally representative sample of 2,012 adults aged 18 and older. The margin of error for total respondents is +/- 2.44 percentage points at the 95% confidence level. The design effect is 1.25. View the questions used for this analysis, along with the responses >>. The questionnaire was developed and the data analyzed by SSRS contributor, John M. Benson, with assistance from the SSRS team.

John M. Benson is a public opinion researcher, academic writer, and editor with over thirty years’ experience examining public attitudes about health policy and other domestic policy issues. He has directed numerous national and international polling projects leading to more than 100 publications in New England Journal of Medicine, Health Affairs, JAMA, Public Opinion Quarterly, Emerging Infectious Diseases, Public Health Reports, Milbank Quarterly, Social Science Research, and other domestic policy and polling journals. He is also co-author of American Public Opinion and Health Care (CQ Press).
The SSRS Opinion Panel Omnibus is a national, twice-per-month, probability-based survey. All SSRS Opinion Panel Omnibus data are weighted to represent the target population of U.S. adults ages 18 or older.
The SSRS Opinion Panel Omnibus is conducted on the SSRS Opinion Panel. SSRS Opinion Panel members are recruited randomly based on a nationally representative ABS (Address Based Sample) design (including Hawaii and Alaska). ABS respondents are randomly sampled by Marketing Systems Group (MSG) through the U.S. Postal Service’s Computerized Delivery Sequence File (CDS), a regularly updated listing of all known addresses in the U.S. For the SSRS Opinion Panel, known business addresses are excluded from the sample frame.
The SSRS Opinion Panel is a multi-mode panel (web and phone). Most panelists take self-administered web surveys; however, the option to take surveys conducted by a live telephone interviewer is available to those who do not use the internet as well as those who use the internet but are reluctant to take surveys online. All sample drawn for this study were SSRS Opinion Panelists who are U.S. adults ages 18 or older. Sample was selected to ensure representation by age, gender, race and ethnicity, education, Census region, and party identification. Possible sources of non-sampling error include non-response bias, as well as question wording and ordering effects.
About SSRS
SSRS is breaking the mold on what research companies can do. A full-service market and survey research firm, we use the latest data collection best practices and apply cutting-edge survey methodologies backed by insight from our industry-leading team. We have genuine enthusiasm for our work and a shared goal to connect people through research. Our solutions include groundbreaking approaches fit for purpose: the SSRS Opinion Panel, Encipher, SSRS Virtual Insights, the SSRS Text Message panel, and more. Our research areas focus on Health Care and Health Policy, Public Opinion and Policy, Political and Election Polling, Consumer and Lifestyle, and Sports and Entertainment.
Media Contact: Karin Bandoian | SSRS Vice President of Brand and Creative Strategy