From entry‑level workers searching for their first foothold to mid‑career adults worried about job security, Americans across the workforce are feeling heightened strain in today’s job market. Their concerns are not abstract—they stem from real experiences in a labor landscape that feels increasingly competitive, uncertain, and uneven by age and class.
The SSRS Economic Attitudes Tracker has been tracking this story as it develops since March 2025, with each wave capturing insights into Americans’ views of the job market. Using data from our nationally representative Opinion Panel, we explore how workers evaluate the job market and how their own employment situations shape those views.
Note: These findings were collected before the outbreak of the war in Iran.
Perceptions of the U.S. job market continue to sour. Nearly half of Americans (47%) now rate the job market as bad, including 17% who say it is very bad. This represents an 8‑point increase in negative evaluations since June 2025, signaling a clear and accelerating shift in public sentiment.
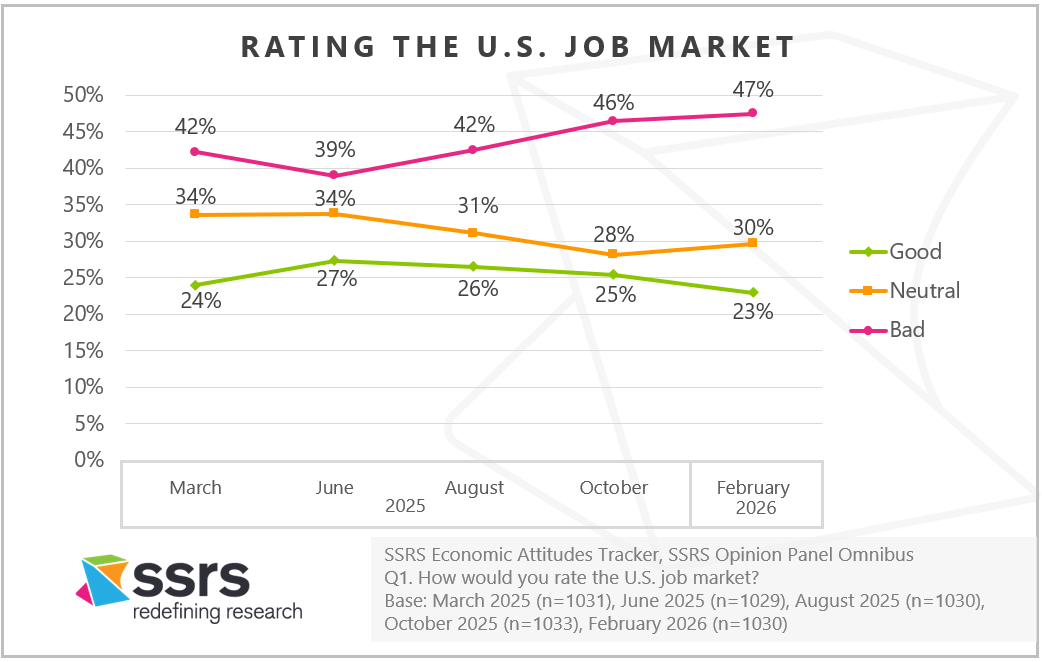
The tough job market is particularly salient among those who identify as lower class or lower‑middle class. Sixty-nine percent of lower‑class Americans and 57% of those in the lower‑middle class describe the job market as bad, compared with 38% of the middle class and 40% of upper‑middle or upper‑class Americans. For many, the labor market is far from a level playing field—and class identity is shaping how bleak it looks.
Worry Runs High—Both Nationally and Personally
As for the outlook on the future, things remain grim. Seven in ten Americans (69%) are worried about the U.S. job market, and 58% are concerned about their ability to find a new job if they needed to.
These views are often rooted in personal experience. In early 2026, 19% of Americans report that their own employment situation is bad, up from 15% at the same time last year. Additionally, over a third (38%) say they are worried about their personal employment situation.
The sense of strain is deepest among those who identify as lower class, 42% of whom say their employment situation is bad. That compares to 25% of the lower middle class, 12% of the middle class, and 9% of those in the upper middle or upper class. Worry follows a similar pattern: 85% of lower class Americans and 81% of the lower middle class are concerned about their employment situation, compared with 62% of the middle class and 60% of the upper middle or upper class.
Younger Workers Are Bearing the Brunt
Generations view—and experience—the job market very differently. Gen Z and Millennials hold the bleakest outlooks, with 62% of Gen Z and 58% of Millennials rating the job market as bad compared to only 45% of Gen X. Concern mirrors these perceptions: 81% of Gen Z and 77% of Millennials say they are worried about the state of the U.S. job market, compared with 69% of Gen X.
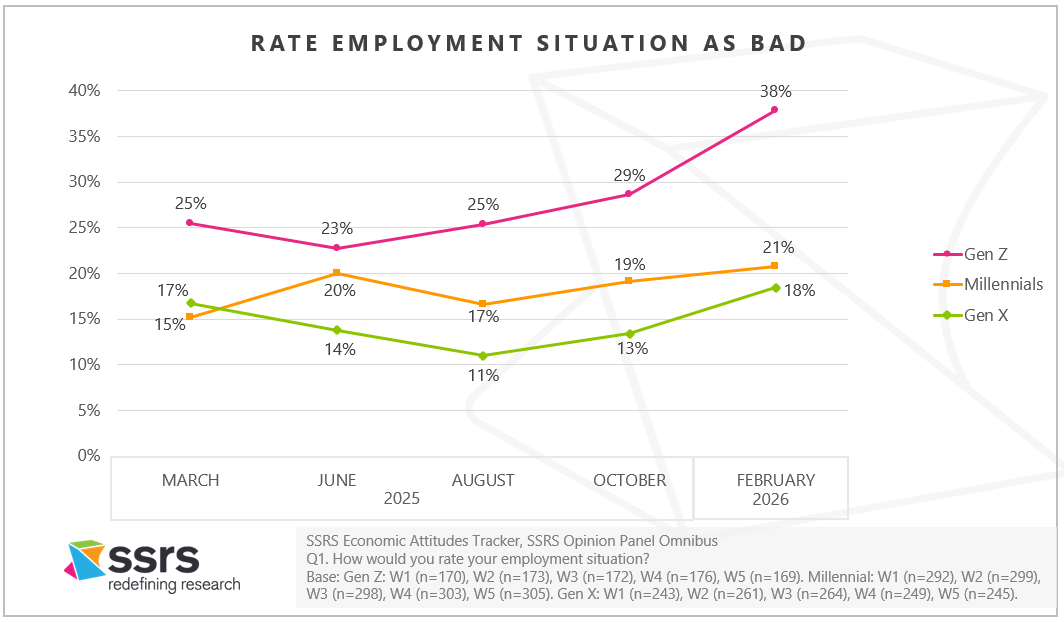
For many younger adults, these attitudes are grounded in their own employment realities. Gen Z’s employment challenges have intensified over the past year, with the share who say their employment situation is bad rising from 25% last year to 38% today. Many in Gen Z are searching for their first jobs—a daunting task in a labor market they perceive as increasingly competitive. By comparison, only 21% of Millennials and 18% of Gen X say their own employment situation is bad.
Generations are more aligned, however, when it comes to concerns about job mobility. Seventy-four percent of Gen Z, 67% of Millennials, and 64% of Gen X worry about their ability to find a new job if necessary, underscoring that anxieties about opportunity cut across age groups.
In Summary
Across generations and social classes, Americans’ views of the job market reflect a growing sense of unease. Younger adults entering the workforce are struggling to gain traction; lower‑income Americans are carrying an outsized share of the burden; and worries about job security are rising broadly. These perceptions—rooted in both personal experience and broader economic uncertainty—shape how people search for jobs, make career decisions, and plan for the future. By capturing these sentiments through our nationally representative Opinion Panel, we provide leaders with an essential window into the workforce’s mindset at a time when clarity is increasingly hard to come by.
Join Our Economic Trends Mailing List
Methodology
The Economic Attitudes Tracker is conducted by SSRS on its Opinion Panel Omnibus platform. The SSRS Opinion Panel Omnibus is a national, twice-per-month, probability-based survey.
Economic Attitudes Tracker waves include:
- March 21 – March 24, 2025, among a sample of 1,031 panelists. The survey was conducted via web (n=1,001) and telephone (n=30) and administered in English (n=1,005) and Spanish (n=26). The margin of error for total respondents is +/-3.8 percentage points at the 95% confidence level. The design effect is 1.54.
- June 6 – June 10, 2025, among a sample of 1,029 respondents. The survey was conducted via web (n=999) and telephone (n=30) and administered in English (n=1,004) and Spanish (n=25). The margin of error for total respondents is +/-3.5 percentage points at the 95% confidence level. The design effect is 1.29.
- August 1 – August 4, 2025, among a sample of 1,030 respondents. The survey was conducted via web (n=1,000) and telephone (n=30) and administered in English (n=1,004) and Spanish (n=26). The margin of error for total respondents is +/-3.5 percentage points at the 95% confidence level. The total sample design effect for this survey is 1.31.
- October 16 – October 19, 2025, among a sample of 1,033 respondents. The survey was conducted via web (n=1,003) and telephone (n=30) and administered in English (n=1,007) and Spanish (n=26). The margin of error for total respondents is +/-3.5 percentage points at the 95% confidence level. The total sample design effect for this survey is 1.34. SSRS recontacted five respondents from the Omnibus survey to invite them to participate in a qualitative in-depth follow-up interview. Each interview lasted 30-minutes and was conducted over Zoom with an SSRS researcher between October 28 – 30, 2025.
- February 5 – February 9, 2026, among a sample of 1,030 respondents. The survey was conducted via web (n=1,000) and telephone (n=30) and administered in English (n=1,004) and Spanish (n=26). The margin of error for total respondents is +/-3.4 percentage points at the 95% confidence level. The total sample design effect for this survey is 1.26.
All SSRS Opinion Panel Omnibus data are weighted to represent the target population of U.S. adults ages 18 or older.
The SSRS Opinion Panel Omnibus is conducted on the SSRS Opinion Panel. SSRS Opinion Panel members are recruited randomly based primarily on nationally representative ABS (Address Based Sample) design (including Hawaii and Alaska). ABS respondents are randomly sampled by Marketing Systems Group (MSG) through the U.S. Postal Service’s Computerized Delivery Sequence File (CDS), a regularly updated listing of all known addresses in the U.S. For the SSRS Opinion Panel, known business addresses are excluded from the sample frame. Additional panelists are recruited via random digit dial (RDD) telephone sample of cell phone numbers connected to a prepaid cell phone. This sample is selected by MSG from the cell phone RDD frame using a flag that identifies prepaid numbers. Prepaid cell numbers are associated with cell phones that are “pay as you go” and do not require a contract.
The SSRS Opinion Panel is a multi-mode panel (web and phone). Most panelists take self-administered web surveys; however, the option to take surveys conducted by a live telephone interviewer is available to those who do not use the internet as well as those who use the internet but are reluctant to take surveys online.