On November 4, 2025, Americans in several states voted in key state and local elections that received national attention. SSRS conducted the first set of Voter Polls in California, New Jersey, Virginia, and New York City for the national news organizations, and several key findings from each Voter Poll offer us indications of trends to watch for in the upcoming 2026 midterm elections.
The Voter Poll by SSRS is a multi-modal research study that assesses the factors behind voter decisions around Election Day. To reflect the various ways U.S. citizens vote (mail, early, in-person, etc.), The Voter Poll combines mailed survey invitations, phone and text interviews, the probability-based SSRS Opinion Panel, verified opt-in panel respondents, and in-person interviews at voting precincts on election day. Learn more in the full methodology at the end of this post.
Key Takeaways from Each Race
New York City – Vote Preference Splits by Age
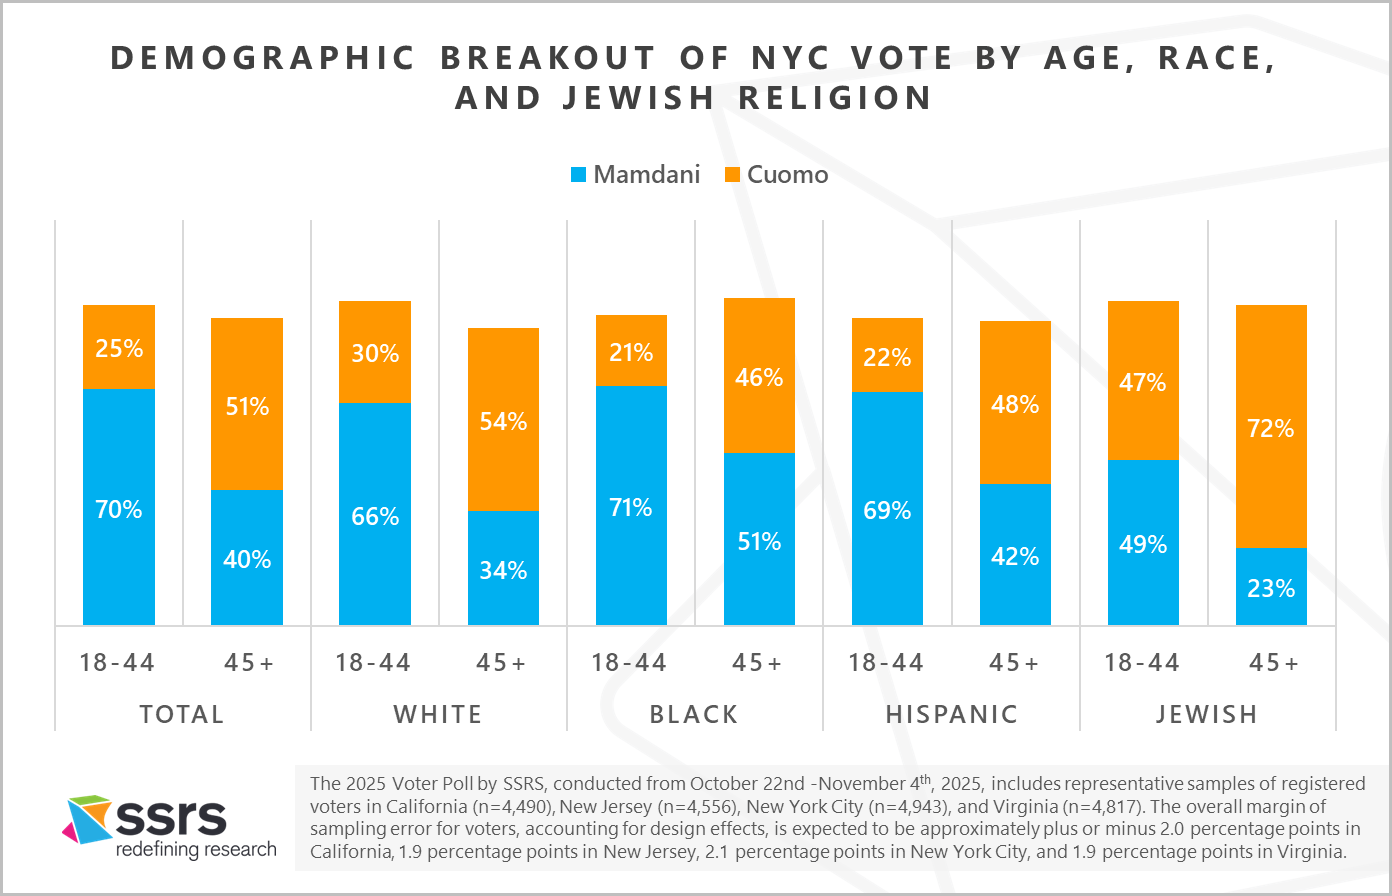
The New York City Mayoral race matched 34 year old Zohran Mamdani against 68 year old Andrew Cuomo, and the generational difference between the two candidates was reflected in the vote by age groups. Overall, 18-44 year olds supported Mamdani over Cuomo 70% to 25%, while voters 45+ supported Cuomo 51% to 40%. The Voter Poll found that the divide between voters under 45 years old and those 45 years and older was large and consistent among all demographic groups.
More specifically, among 18-44 year old White voters, Mamdani won 66% to 30%, while Cuomo carried 45+ White voters 54% to 34%. Similar splits were found among Blacks (18-44: Mamdani 71% to 21%; 45+ Mamdani 51% to 46%), Hispanics (18-44 Mamdani: 69% to 22%; 45+ Cuomo: 48% to 42%) and Jewish voters (18-44 Mamdani: 49% to 47%; 45+ Cuomo: 72% to 23%).
It’s likely that this type of generational divide will continue in Democratic primaries in 2026 and will be something to watch in the upcoming months.
New Jersey – Hispanics Swing Back to the Democrats
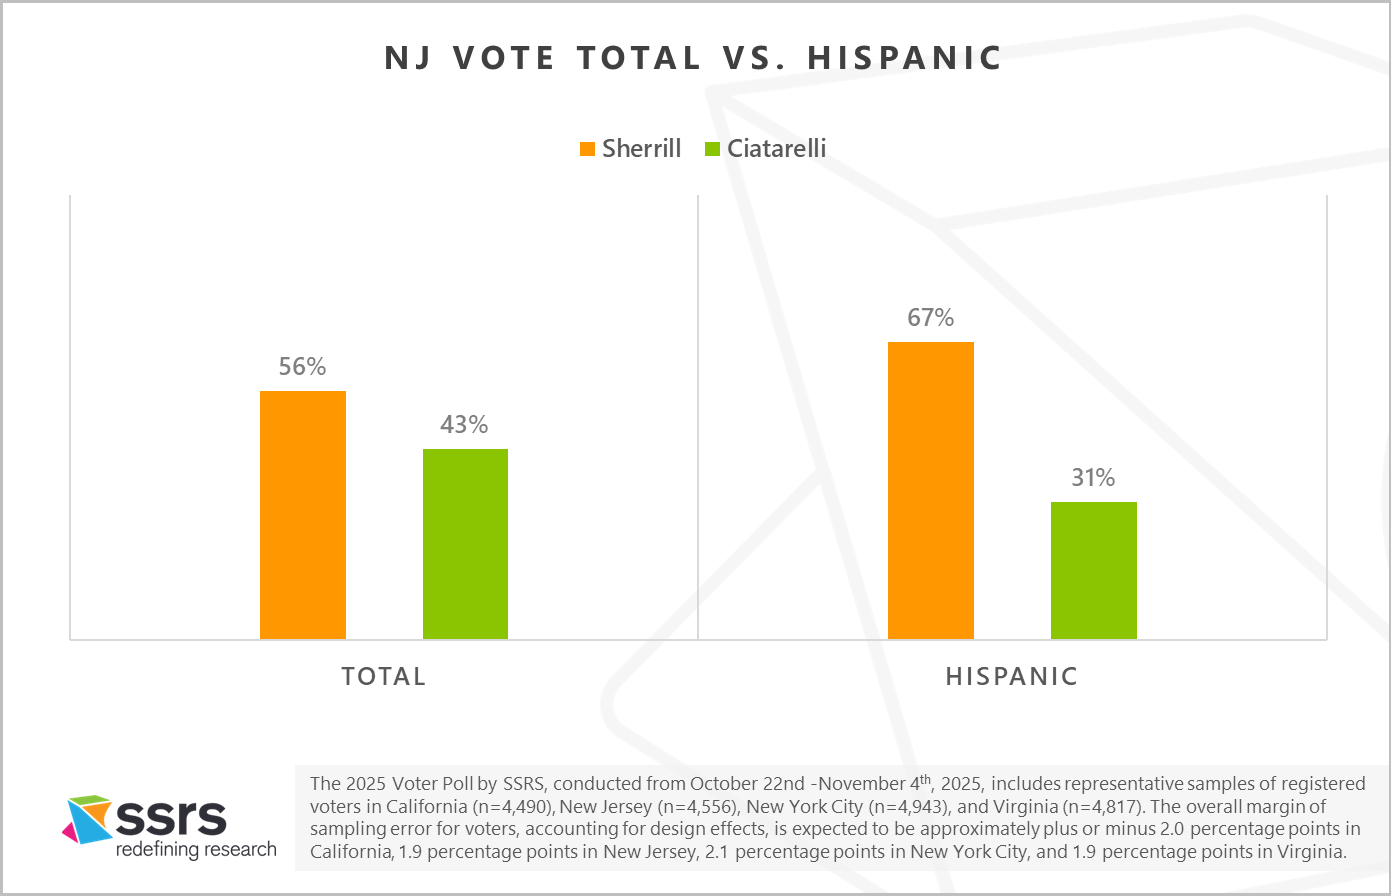
The 2024 Presidential election saw Donald Trump receive 46% of the Hispanic vote nationally, which was the highest share for a Republican candidate in decades. Republicans had hoped that this trend would help make the 2025 New Jersey Governor’s race competitive. However, according to The Voter Poll, Hispanics in New Jersey swung back to the Democrats in 2025.
Democrat Mikie Sherrill carried Hispanics by more than a 2-1 advantage (67% to 31%). This contributed to large swings to the Democrat in high Hispanic counties such as Passaic County, which Trump had carried by three points in 2024, but Sherrill won by 16 points in 2025. One of the keys for the Democratic chances in the 2026 midterm elections is whether their performance among Hispanics in 2025 can be repeated in 2026.
Virginia – Federal Cuts Impacted Vote Choice
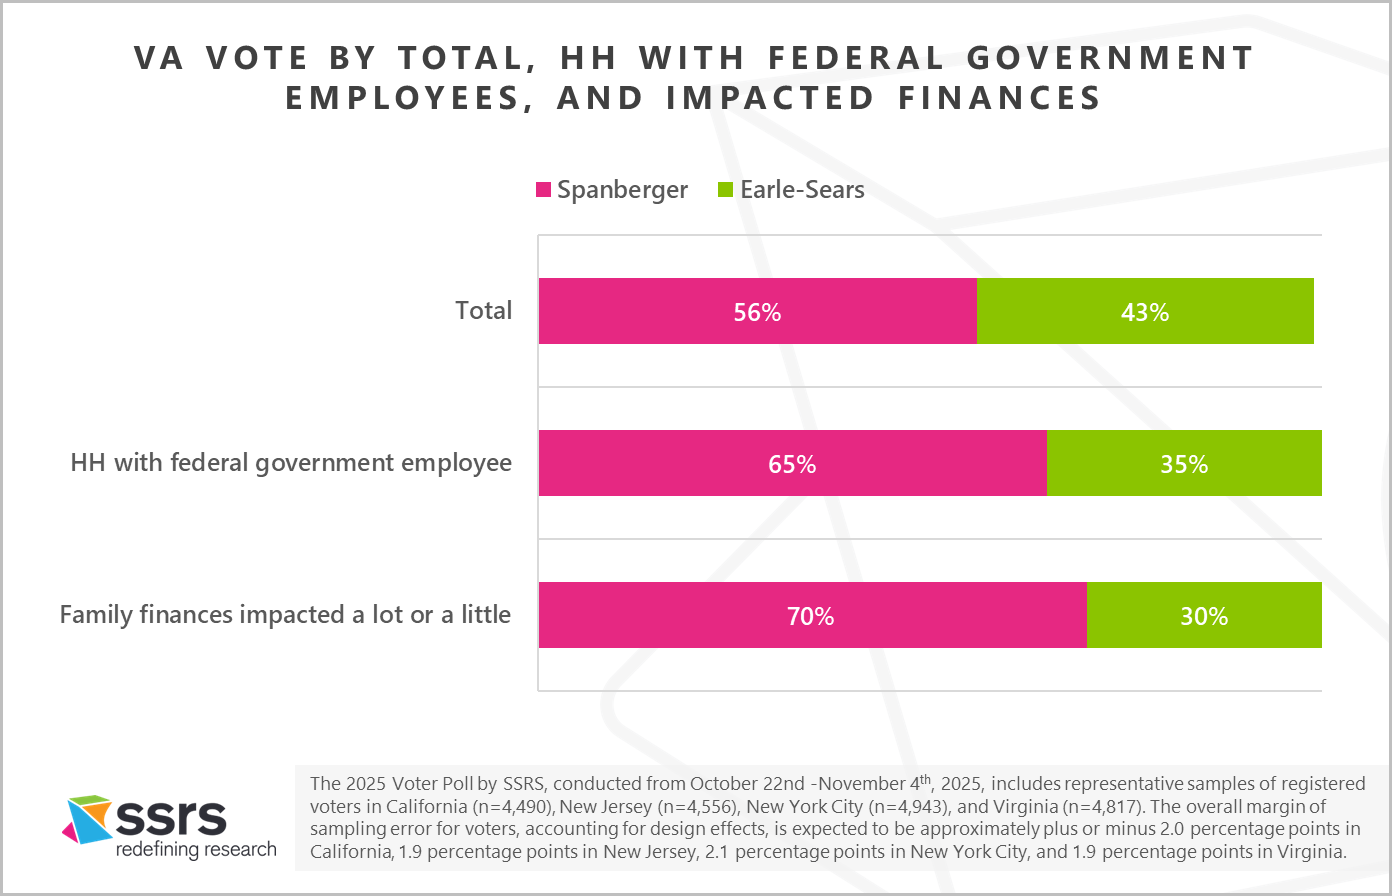
In Virginia, the Voter Poll measured the effect of the federal government cuts this year on an electorate with a relatively large number of federal employees. More than one fifth of Virginia voters (22%) said that they live in a household with a federal government employee or a federal contractor. Those voters chose Democrat Abigail Spanberger for governor by a nearly two-to-one margin (65% to 35%).
The Voter Poll also asked how much the federal government cuts have affected the family finances of the voter. A majority of Virginia voters reported their family’s finances were affected either a lot (20%) or a little (40%), and 70% of them voted for Spanberger.
The effect of the federal government cuts on the finances of voters will be another indicator of how well Democrats may do in the 2026 midterms.
California – Congressional Boundary Changes Approved, but Driven by Dissatisfaction with Trump
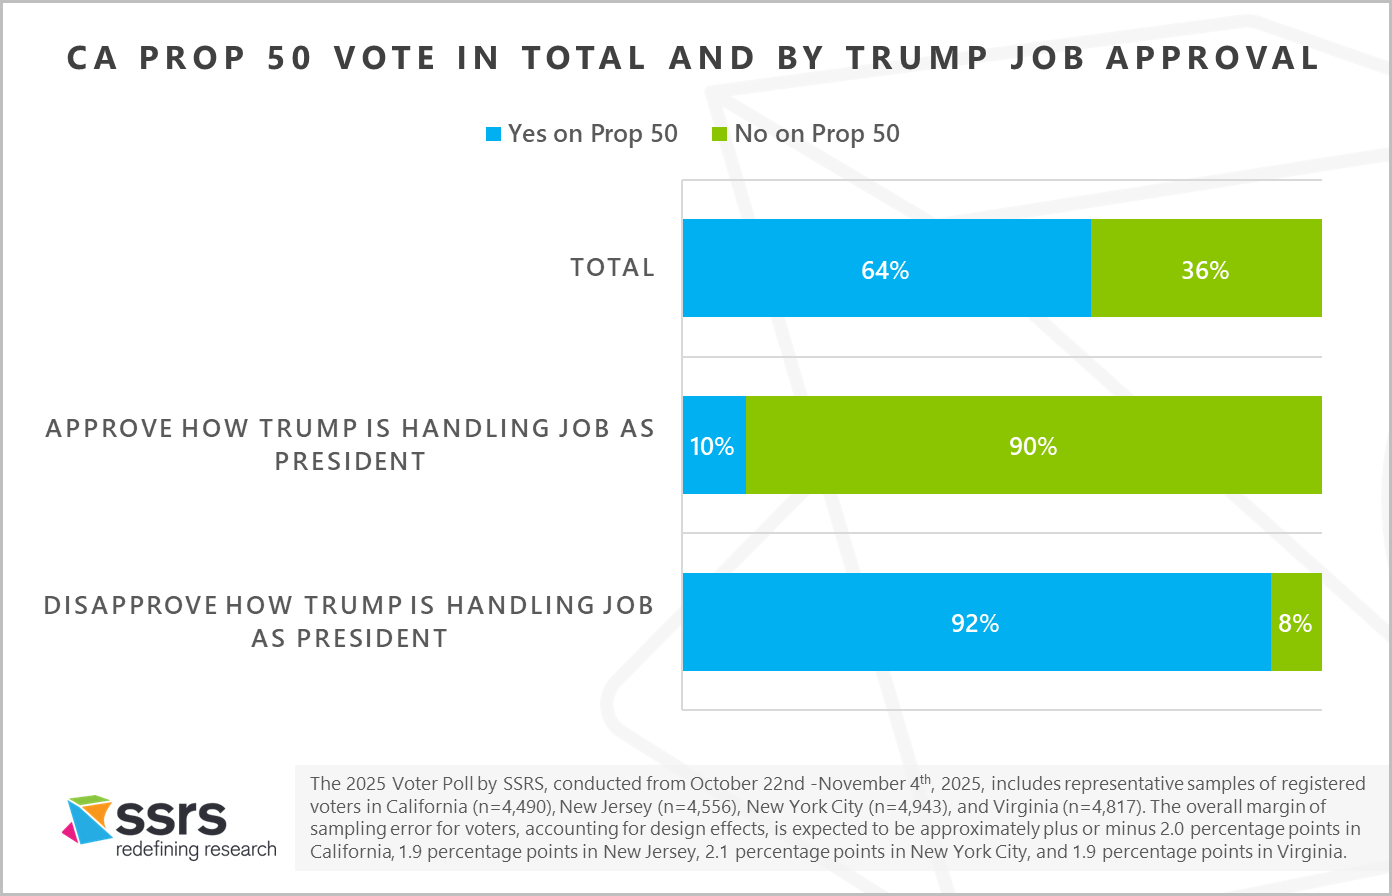
On November 4th, with 64% voting Yes, California voters approved Proposition 50, which authorized the congressional district boundary changes that Governor Gavin Newsom and the Democrats in the state legislature passed in response to the Republican-led redistricting in Texas. According to The Voter Poll, the support for Prop 50 was driven predominantly by disapproval of the way Donald Trump is handling his job as president. The survey showed 65% job disapproval for Trump, and 92% of those who disapproved voted Yes. Only 10% of those who approved of how Trump is doing voted yes on Prop 50.
The results in California are another indication of the trend of state and congressional election results being driven by presidential job approval.
Presidential Job Approval Ratings Affecting Results in All Four Areas Surveyed
On top of California, we saw similar results in the New Jersey and Virginia governor’s races. In the New Jersey Voter Poll, Trump’s job disapproval was 56% and Democrat Mikie Sherrill received 56% of the vote among New Jersey voters. In the Virginia Voter Poll, Trump’s job disapproval was 59% and Democrat Abigail Spanberger received 58% of the vote among Virginia voters.
Donald Trump’s job approval will be a key indicator of Republican strength in the 2026 midterm elections. Historically if a sitting president’s job approval is below 45%, the president’s party loses a significant number of seats in the U.S. House. So Presidential job approval both at the state and national level will be an important metric to monitor in the next several months as many U.S. House seats and several Senate seats will be up for grabs, thus potentially changing the overall political composition of the legislative branch.
Learn More About The Voter Poll by SSRS >
Methodology
The 2025 Voter Poll by SSRS, conducted from October 22nd -November 4th, 2025, includes representative samples of registered voters in California (n=4,490), New Jersey (n=4,556), New York City (n=4,943), and Virginia (n=4,817). The Voter Poll combines data collected from verified registered voters online and by telephone, with data collected in-person from Election Day voters at 30 precincts per state/city, excluding California. Respondents can complete the poll in English or Spanish. The overall margin of sampling error for voters, accounting for design effects, is expected to be approximately plus or minus 2.0 percentage points in California, 1.9 percentage points in New Jersey, 2.1 percentage points in New York City, and 1.9 percentage points in Virginia.