As part of our year-end giving, in December 2025, SSRS made a donation to our local food bank, the Delco Food Project. With food insecurity on the rise, we hope this small gesture will help to make a meaningful difference in our community.
Because we’re researchers by profession and at heart, we thought we’d also check in with Americans through the SSRS Opinion Panel Omnibus to gauge national support for food banks, to see how rising food costs are affecting households, and what Americans think should be done about it.
- Our SSRS Opinion Panel Omnibus is a multi-client, probability-based survey that fields twice a month. It delivers a nationally representative sample of about 1,000 adults aged 18 or older in English (with a Spanish language option).
- Learn more about how to use our Omnibus >>
The SSRS Opinion Panel Omnibus poll was conducted between December 19 – 22, 2025 among a nationally representative sample of 1,042 adults aged 18 and older. Read below to learn about:
- How Americans themselves are supporting local food banks
- Perceptions of the seriousness of rising food costs
- How Americans are adjusting to rising food costs
- Who they think should be responsible for bringing costs down
- Who is food insecure in America
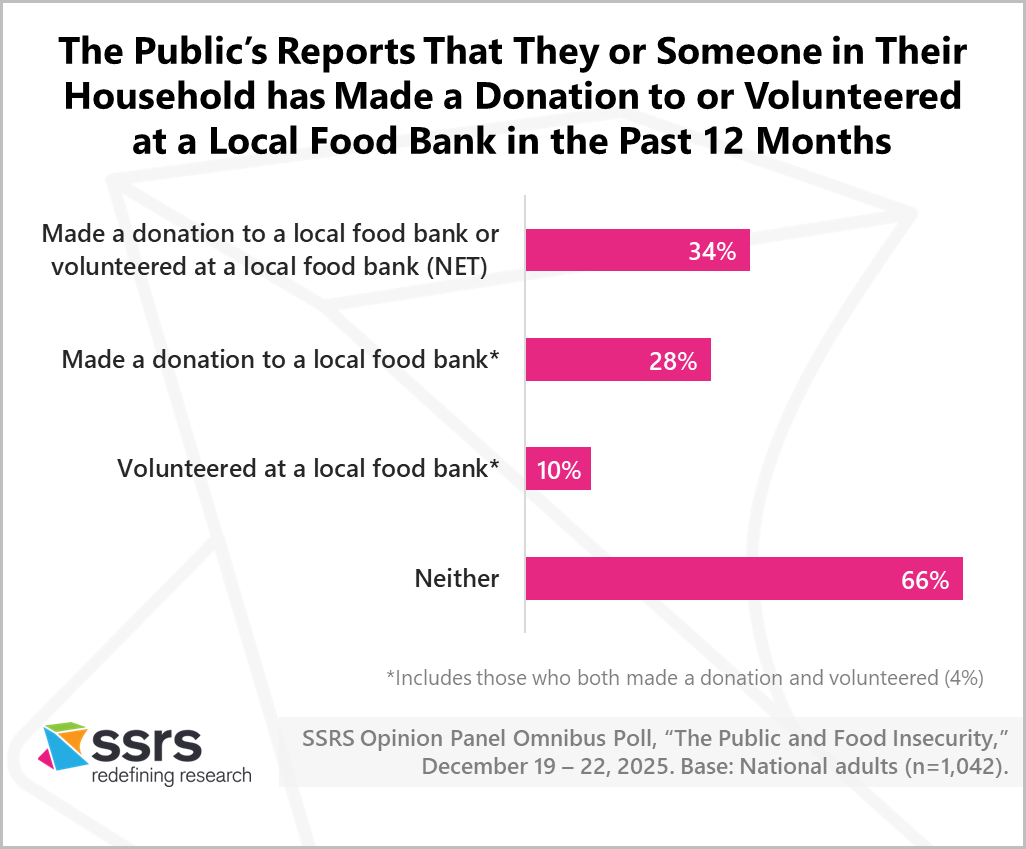
Helping Local Food Banks
SSRS was not the only one supporting food banks in 2025. About one in three adults (34%) report that they or someone in their household has either made a donation to (28%) or volunteered for (10%) a local food bank in the past 12 months. This includes 4% who say they have done both.
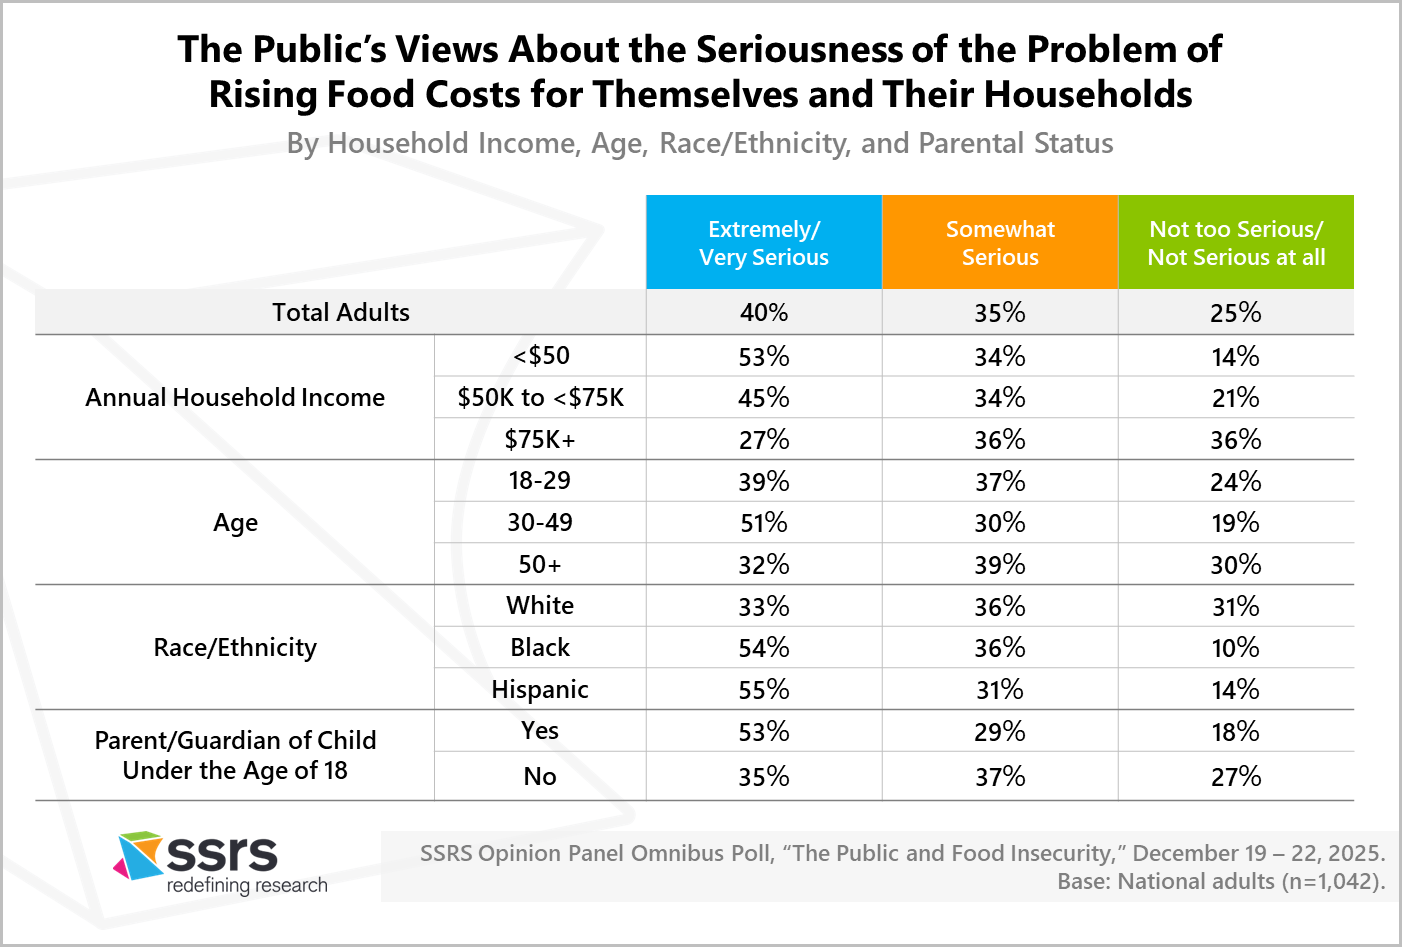
Perceptions of Rising Food Costs
Four in ten U.S. adults (40%) report that the problem of rising food costs is extremely (17%) or very serious (23%) for themselves and their households. About one in three (35%) report that rising food costs are a somewhat serious problem, and 25% that they are not too serious or not a problem at all.
More than half of Hispanic (55%) and Black adults (54%), adults with household incomes under $50,000 per year (53%), parents or guardians of children under age 18 (53%), and 30-49-year-olds (51%) believe that the problem of rising food costs is an extremely or very serious problem for themselves and their households.
In addition, parents or guardians of children under age 18 are more likely than other adults (53% to 35%) to believe that the problem of rising food costs is an extremely or very serious problem for themselves and their households.
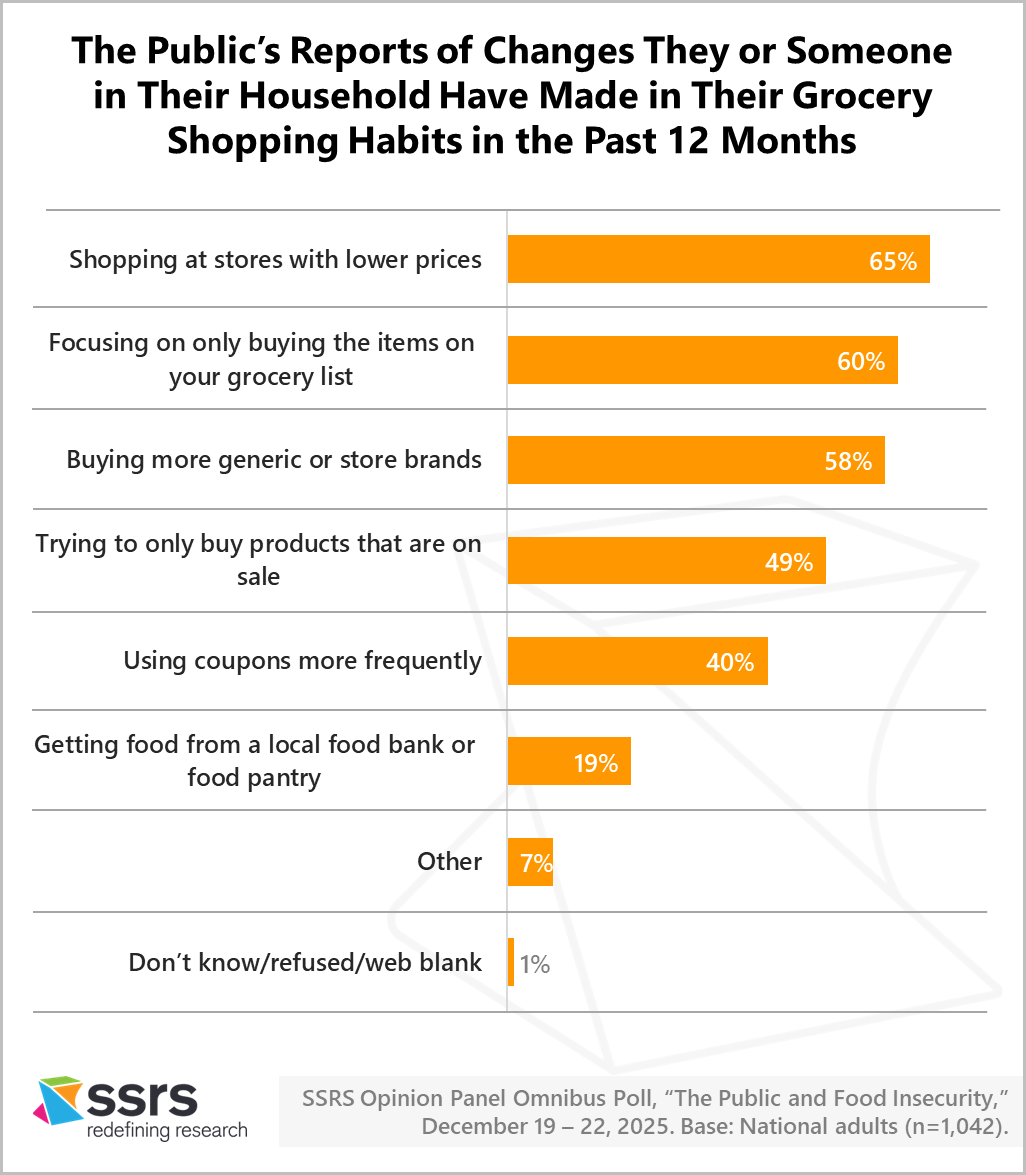
Changes in Grocery Shopping Habits
When asked what changes they have made in their grocery shopping habits in the past 12 months, a majority of U.S. adults report that they or someone in their household has shopped at stores with lower prices (65%), focused on only buying the items on their grocery list (60%), and bought more generic or store brands (58%). About half (49%) say they or someone in their household has been trying to buy only products that are on sale.
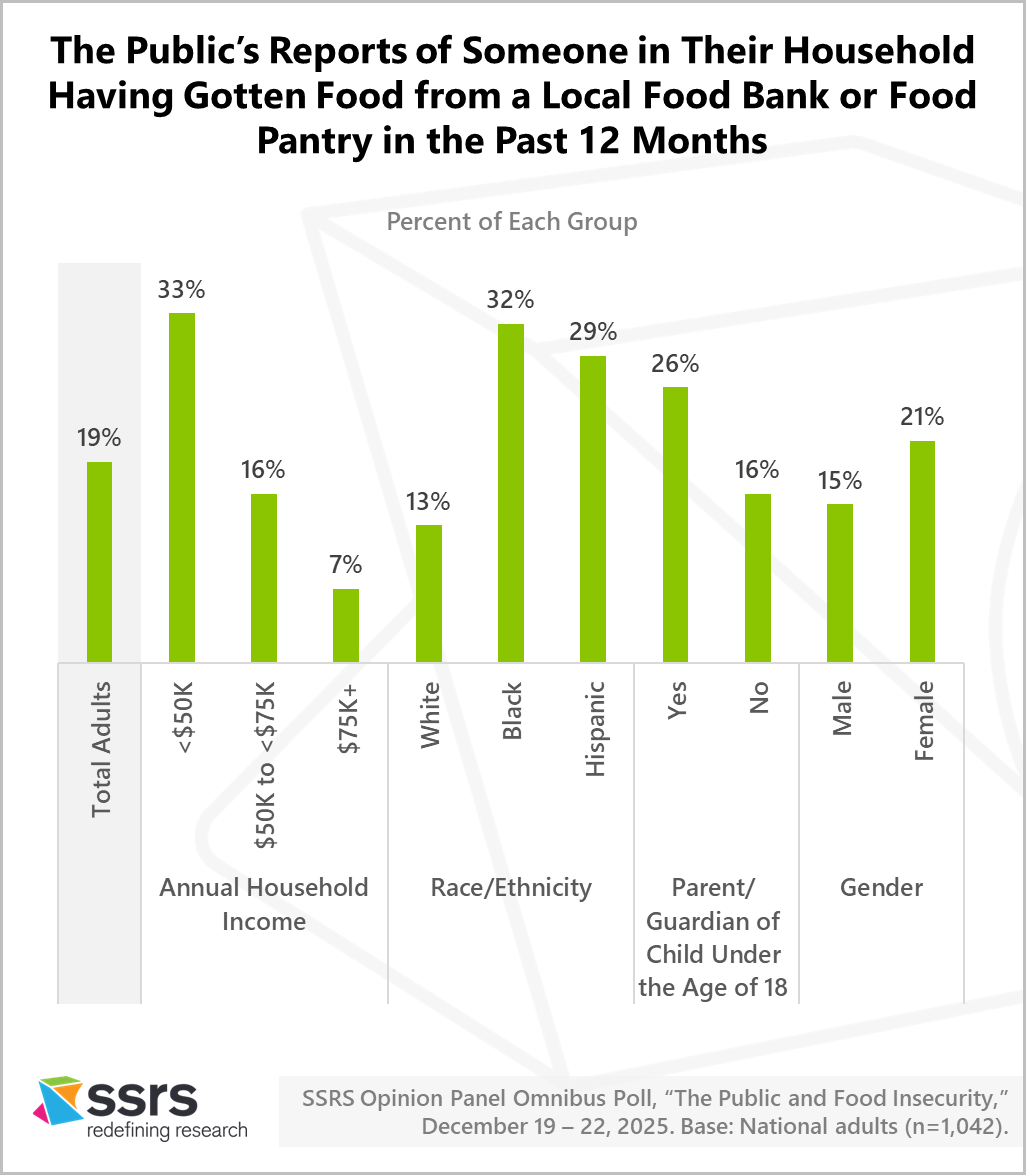
About one in three adults with household incomes under $50,000 per year (33%) and Black adults (32%) report that they or someone in their household has gotten food from a local food bank or food pantry in the past 12 months.
Parents or guardians of children under age 18 are more likely than other adults (26% to 16%) and women more likely than men (21% to 15%) to report that they or someone in their household has gotten food from a local food bank or food pantry in the past 12 months.
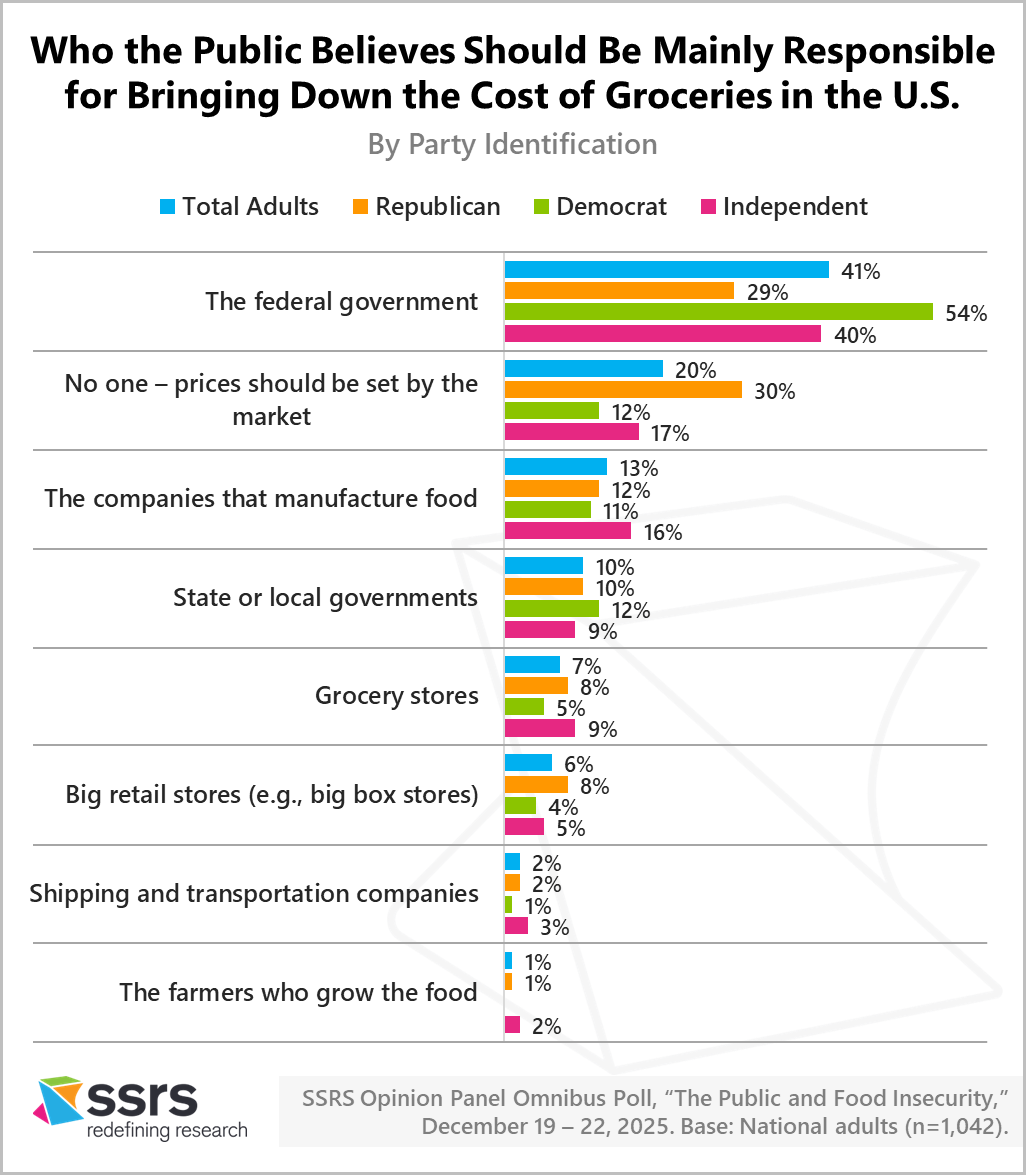
Who’s Responsible for Bringing Down the Cost of Groceries in the U.S.
On the question of who should be mainly responsible for bringing down the cost of groceries in the U.S., the top choice is the federal government (41%), followed by no one (prices should be set by the market) (20%), the companies that manufacture food (13%), and state or local governments (10%).
Democrats (54%) and Independents (40%) are more likely than Republicans (29%) to believe the federal government should be mainly responsible for bringing down grocery costs. Republicans (30%) are more likely than Democrats (12%) and Independents (17%) to believe that no one should be responsible for bringing down grocery prices, that prices should be set by the market.
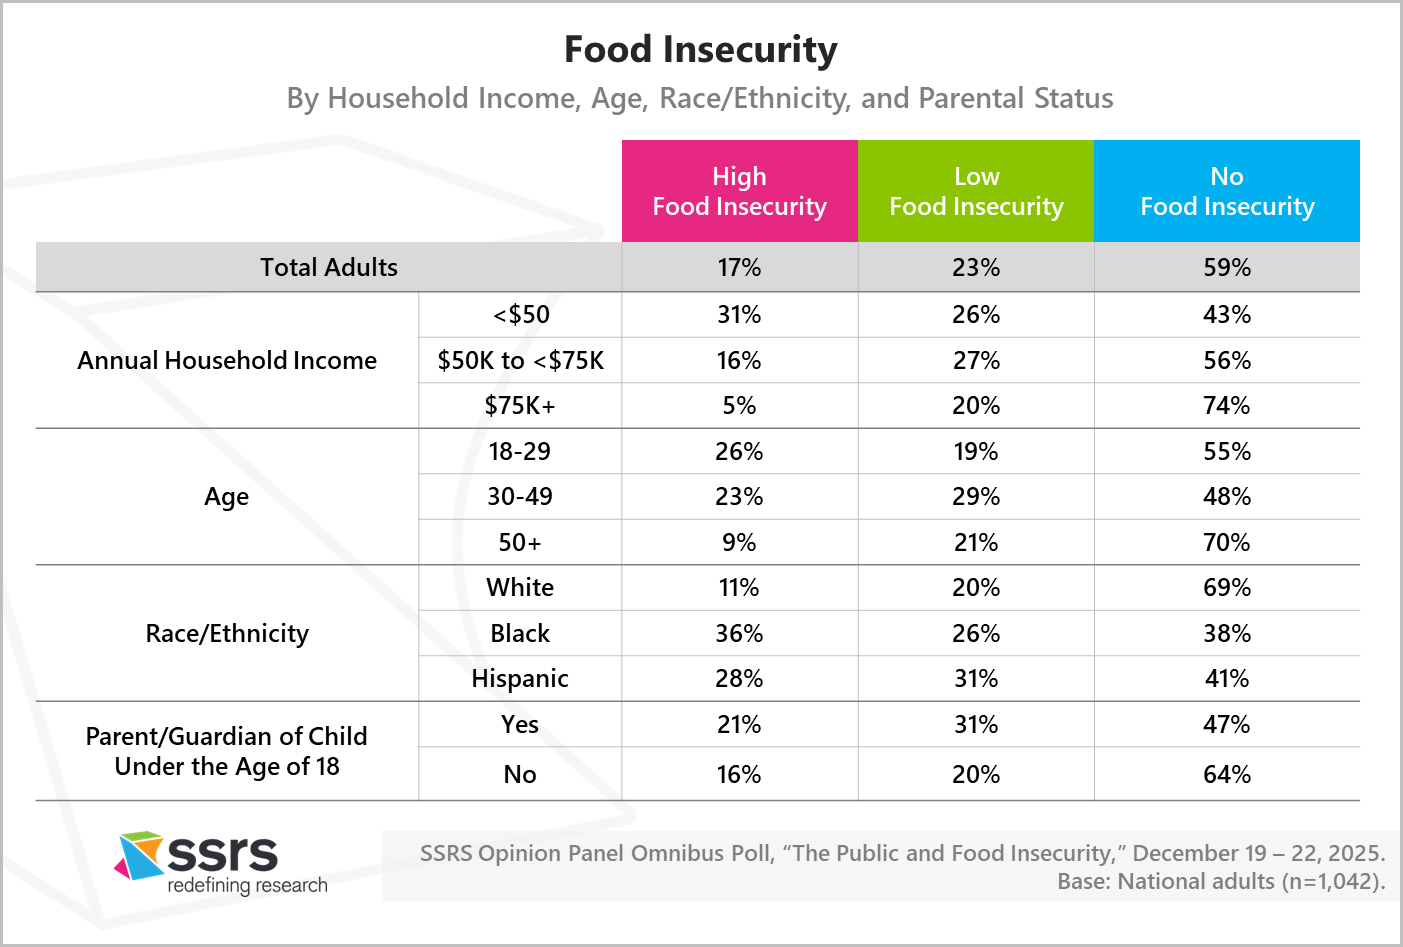
Food Insecurity in the U.S.
Based on the questions we asked in this Omnibus study about people’s experiences acquiring food in 2025, we combined responses together to create a Food Insecurity Index (FII) that identifies three categories of food insecurity (high, low and none).
- Households with high food insecurity (17%) are those that ran out of food, had at least one day going hungry, or used a food bank in the past year and expressed extremely or very serious concerns about rising food costs.
- Households with low food insecurity (23%) are those that did not experience challenges in getting food in the past year, but made some changes to their grocery shopping habits as a result of high costs and expressed extremely or very serious concerns about rising food costs.
- Finally, households with no food insecurity (59%) are those that did not have any hunger challenges or make any changes to their shopping habits and did not express serious concerns about rising food costs.
More than three in ten Black adults (36%) and adults with household incomes under $50,000 per year (31%) experience high food insecurity, as well as more than one in four Hispanic adults (28%) and 18-29-year-olds (26%).
In addition, parents or guardians of children under age 18 are less likely than other adults (64% to 47%) to experience no food insecurity.
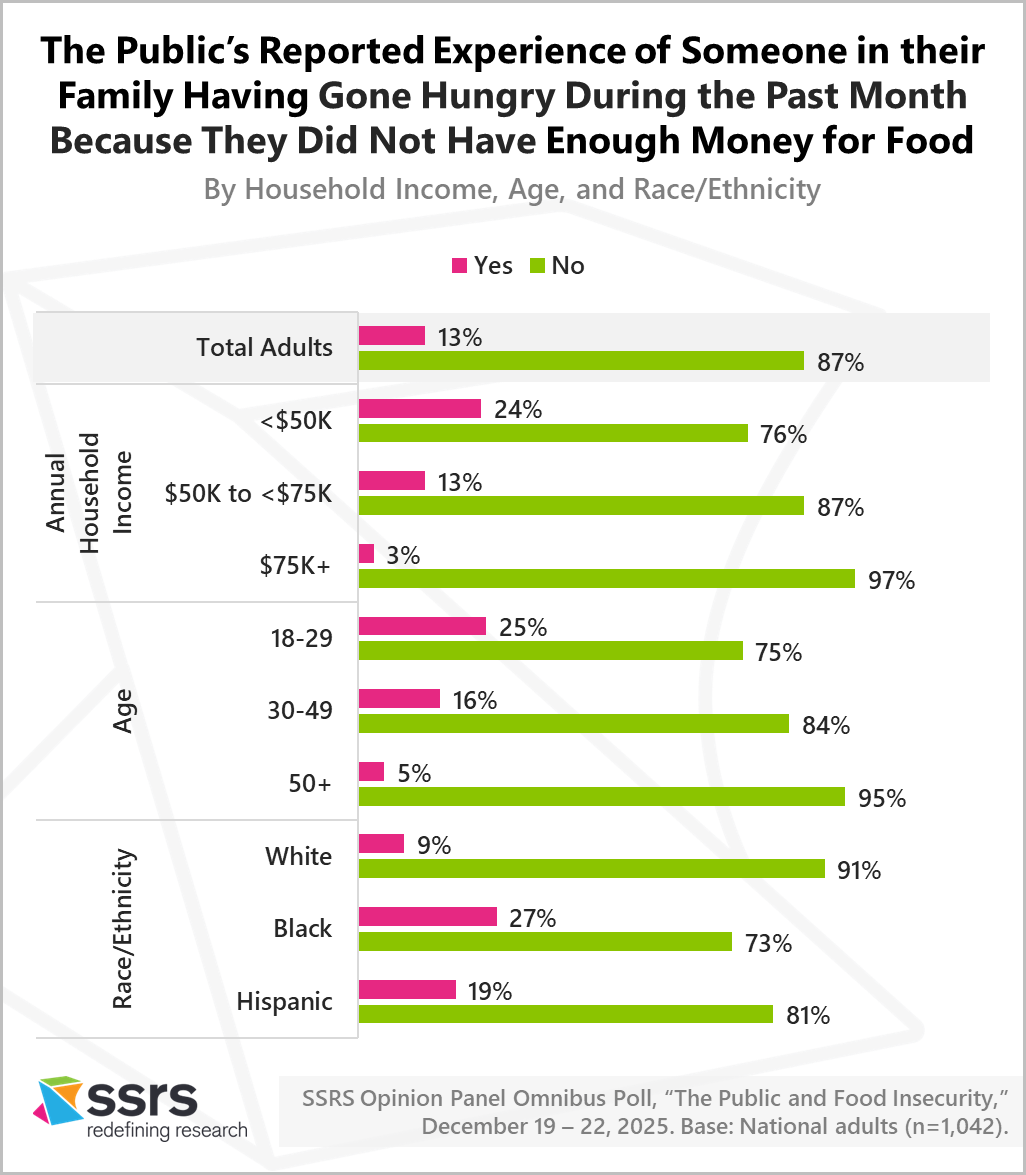
About one in eight U.S. adults (13%) report that in the past month there was a day when they or someone in their family went hungry because they did not have enough money for food. Some groups report this experience more often: about one in four Black adults (27%), 18-29-year-olds (25%), and adults with household incomes under $50,000 per year (24%) report that in the past month there was a day when they or someone in their family did not have enough money for food.
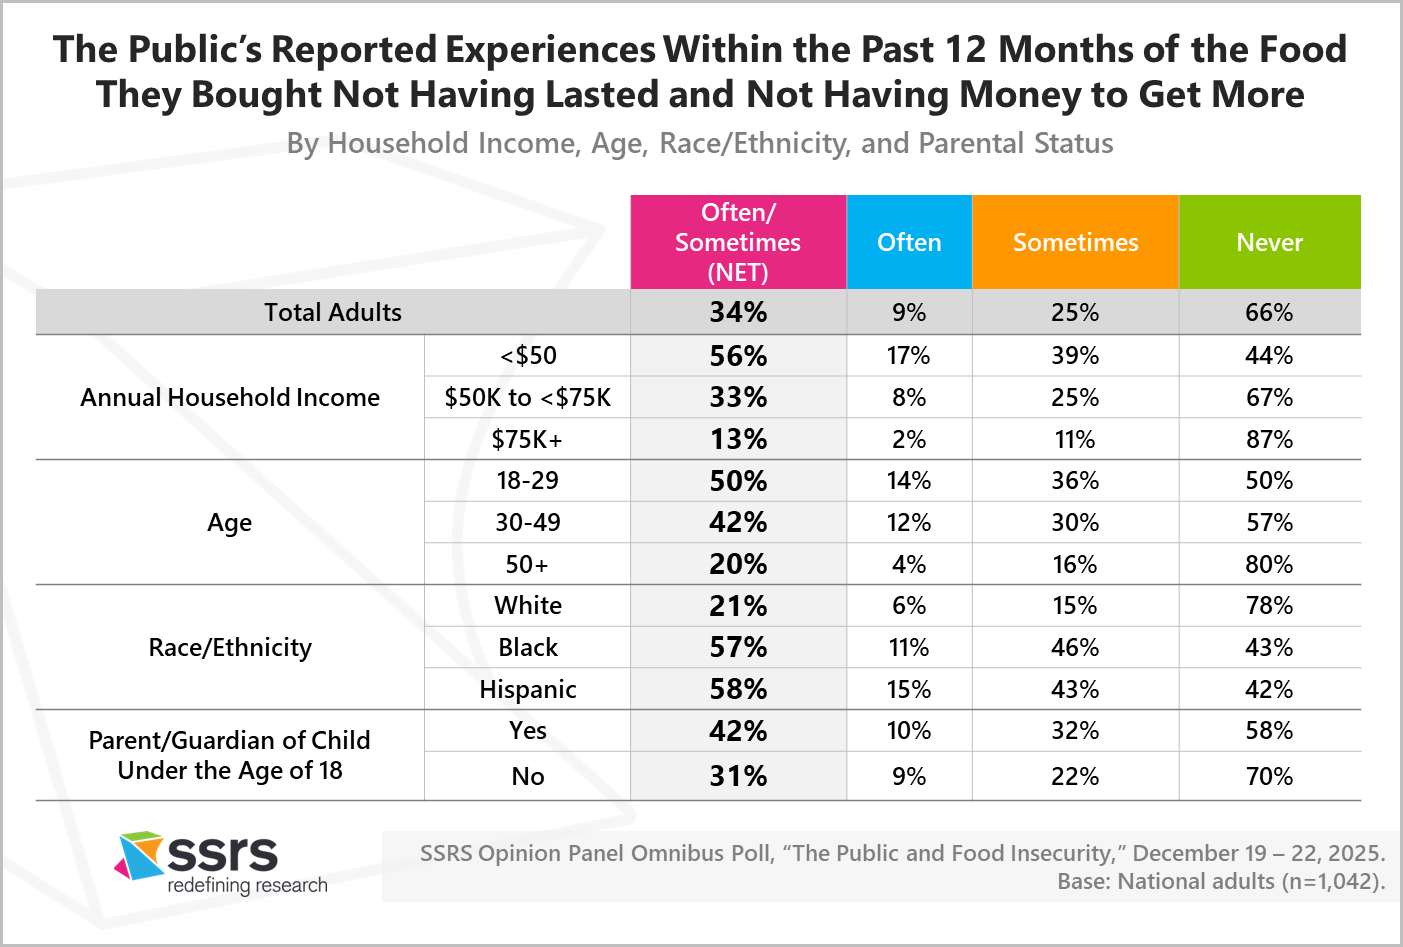
About one-third of U.S. adults (34%) report that at least sometimes within the past 12 months the food they bought just did not last and they did not have money to get more, including 9% who say this happened often. One half or more of Hispanic (58%) and Black adults (57%), adults with household incomes under $50,000 per year (56%), and 18-29-year-olds (50%) report that at least sometimes in the past 12 months the food they bought did not last and they did not have money to get more.
In addition, parents or guardians of children under age 18 are more likely than other adults (42% to 31%) to report that at least sometimes in the past 12 months the food they bought did not last and they did not have money to get more.
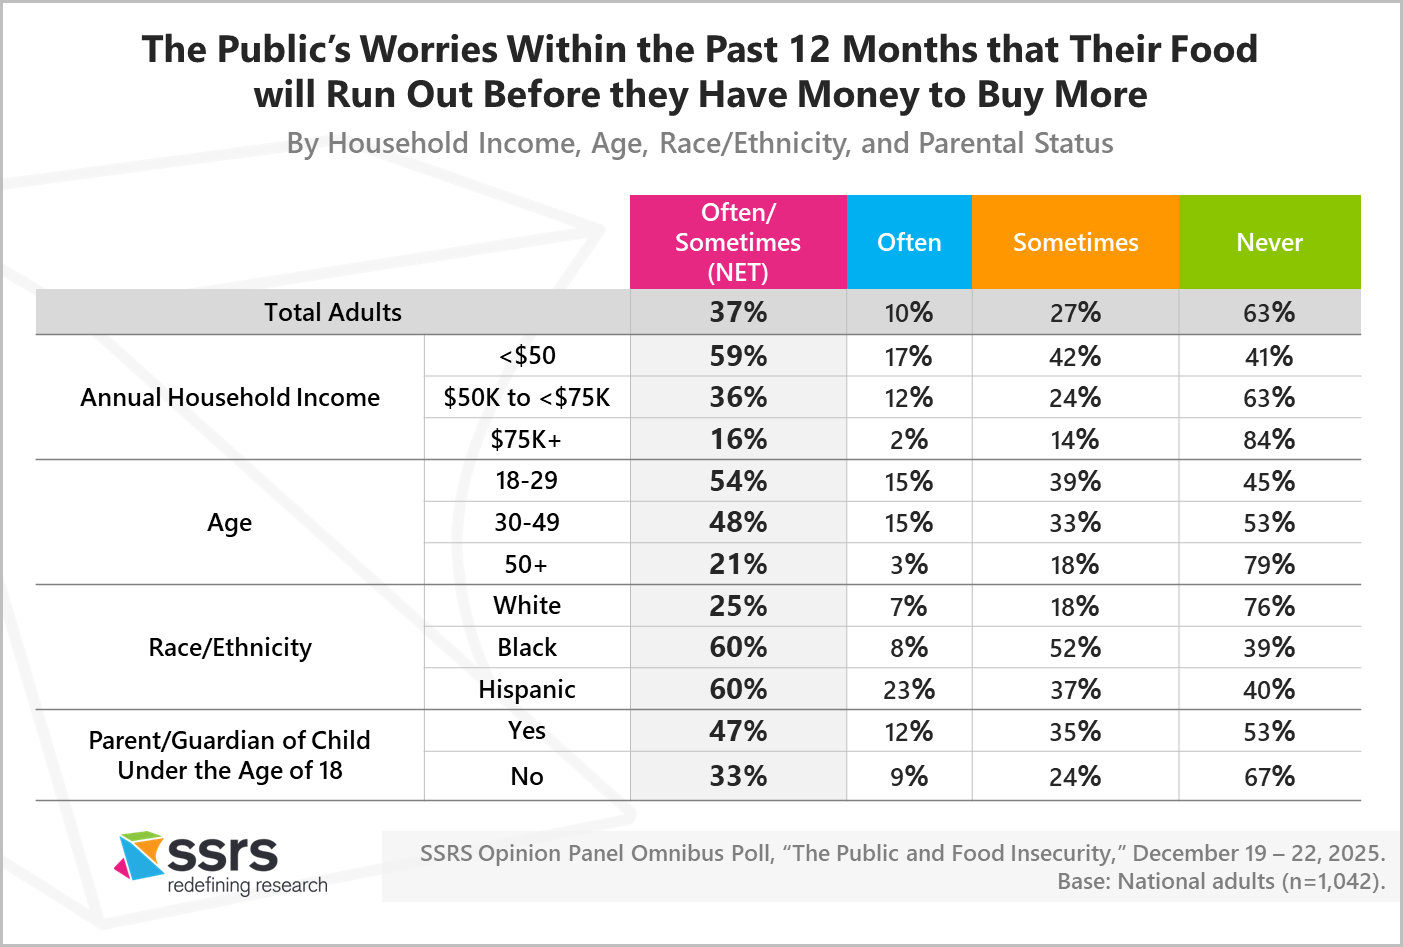
More than one-third of U.S. adults (37%) report that within the past 12 months they have at least sometimes worried that their food would run out before they got money to buy more; this includes 10% who say they worried often. More than half of Black (60%) and Hispanic adults (60%), adults with household incomes under $50,000 per year (59%), and 18-29-year-olds (54%) report that at least sometimes in the past 12 months they have worried that their food will run out before they have money to buy more.
In addition, parents or guardians of children under age 18 are more likely than other adults (47% to 33%) to report that at least sometimes in the past 12 months the food they have worried that their food will run out before they have money to buy more.
Methodology
Interviews for this study were conducted on the SSRS Opinion Panel Omnibus on December 19 – 22, 2025, among a nationally representative sample of 1,042 respondents aged 18 and older. The margin of error for total respondents is +/-3.5 percentage points at the 95% confidence level. The design effect is 1.34.
The SSRS Opinion Panel Omnibus is a multi-client, probability-based survey that fields twice a month. It delivers a nationally representative sample of 1,000 adults aged 18 or older in English (with Spanish language option). Data collection is conducted online and via phone (for non-internet and web-reluctant respondents) using the probability-based SSRS Opinion Panel.
All SSRS Opinion Panel Omnibus data are weighted to represent the target population of U.S. adults ages 18 or older. View the questions used for this analysis, along with the responses (topline).
The SSRS Opinion Panel Omnibus is conducted on the SSRS Opinion Panel. SSRS Opinion Panel members are recruited randomly based on a nationally representative ABS (Address Based Sample) design (including Hawaii and Alaska). ABS respondents are randomly sampled by Marketing Systems Group (MSG) through the U.S. Postal Service’s Computerized Delivery Sequence File (CDS), a regularly updated listing of all known addresses in the U.S. For the SSRS Opinion Panel, known business addresses are excluded from the sample frame.
The SSRS Opinion Panel is a multi-mode panel (web and phone). Most panelists take self-administered web surveys; however, the option to take surveys conducted by a live telephone interviewer is available to those who do not use the internet as well as those who use the internet but are reluctant to take surveys online. All sample drawn for this study were SSRS Opinion Panelists who are U.S. adults ages 18 or older. Sample was selected to ensure representation by age, gender, race and ethnicity, education, Census region, and party identification. Possible sources of non-sampling error include non-response bias, as well as question wording and ordering effects.