A new SSRS Opinion Panel Omnibus poll finds that:
- A large majority of U.S. adults continue to see federal statistics, such as the unemployment rate, the population count, and obesity statistics, as important for decision-making and understanding our society.
- However, U.S. adults are divided on whether they tend to trust federal statistics and on how much confidence they have in the federal agencies that collect them.
- Over the past year, the proportion of the public that tends to trust federal statistics has declined.
- The proportion of the public that expresses a great deal or quite a lot of confidence in federal statistics, the federal government, and state governments has also declined since 2025.
These findings are part of an SSRS Opinion Panel Omnibus poll conducted March 19 – 22, 2026, among a nationally representative sample of 1,030 adults aged 18 and older.
The Public’s Views About the Importance of Federal Statistics
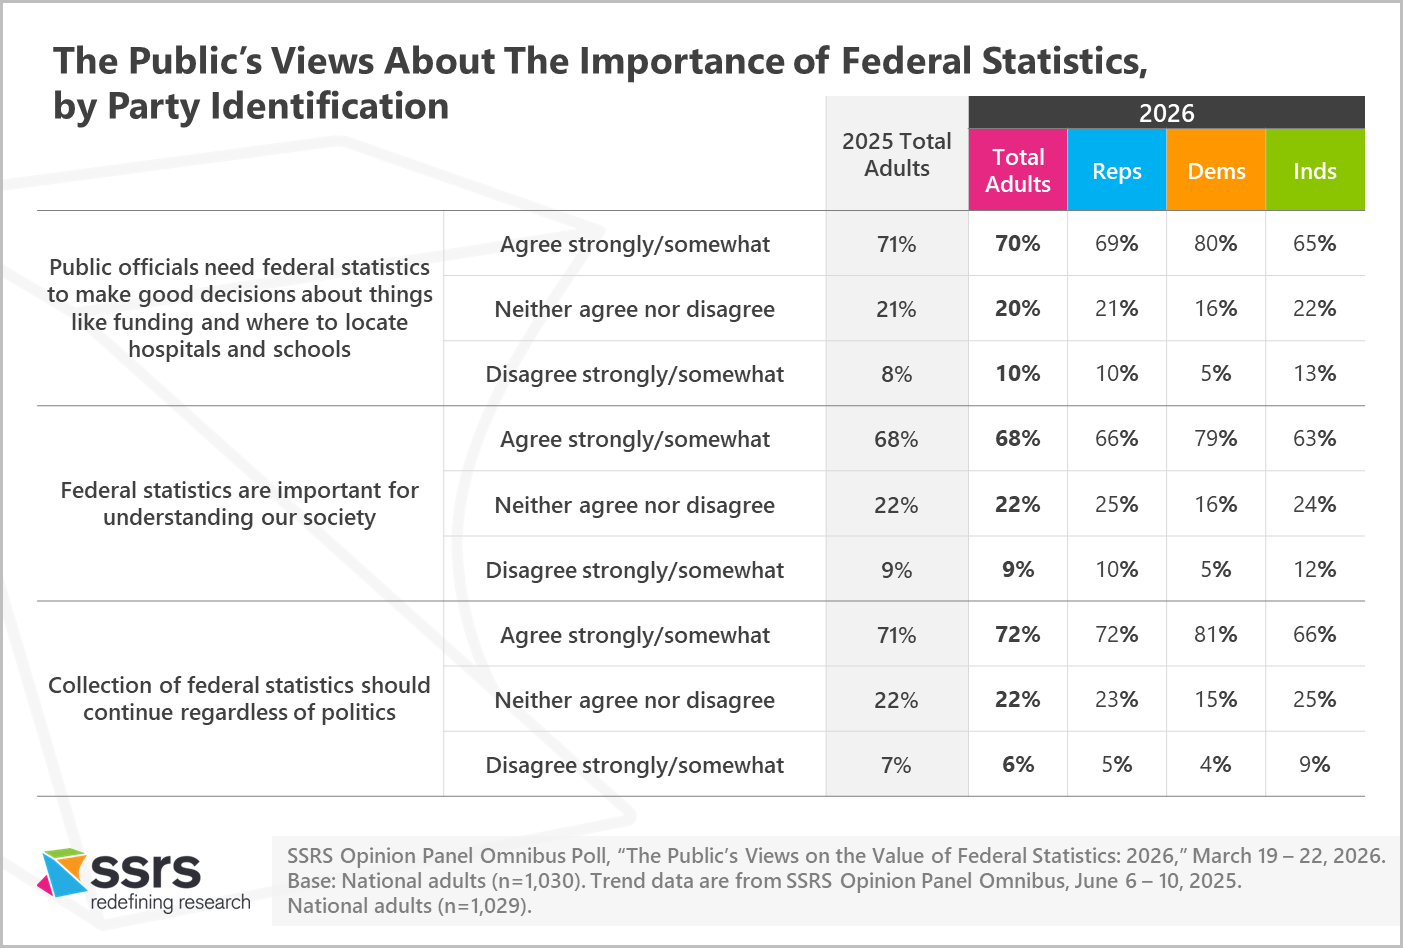
More than two-thirds of the U.S. adults see federal statistics, such as the unemployment rate, the population count, and obesity statistics, as important for decision-making and understanding our society.
- 70% believe public officials need federal statistics to make good decisions about things like funding and where to locate hospitals and schools.
- 68% believe federal statistics are important for understanding our society.
- 72% believe the collection of federal statistics should continue regardless of politics.
There has been virtually no change in the public’s attitudes on these measures since 2025.
Majorities of all major demographic groups share each of these positive views about federal statistics, including majorities of Republicans, Democrats, and Independents,
Public Confidence in Federal Statistics and the Federal Agencies That Collect Them
However, U.S. adults are divided in their attitudes about federal statistics and the federal agencies that collect them.
Tendency to trust or not trust federal statistics. About half (53%) report that they tend not to trust federal statistics in the U.S.; 47% say they tend to trust them.
The proportion of U.S. adults who tend to trust federal statistics has declined from 53% in 2025 to 47% in 2026.
Currently, Republicans (53%) and Democrats (50%) do not differ significantly on whether they tend to trust federal statistics, but Independents (39%) are significantly less likely to express trust. Among Independents, the tendency to trust federal statistics has declined from 47% in 2025 to 39% in 2026.
College graduates are more likely than those without a college degree (54% to 42%) to express trust in federal statistics.
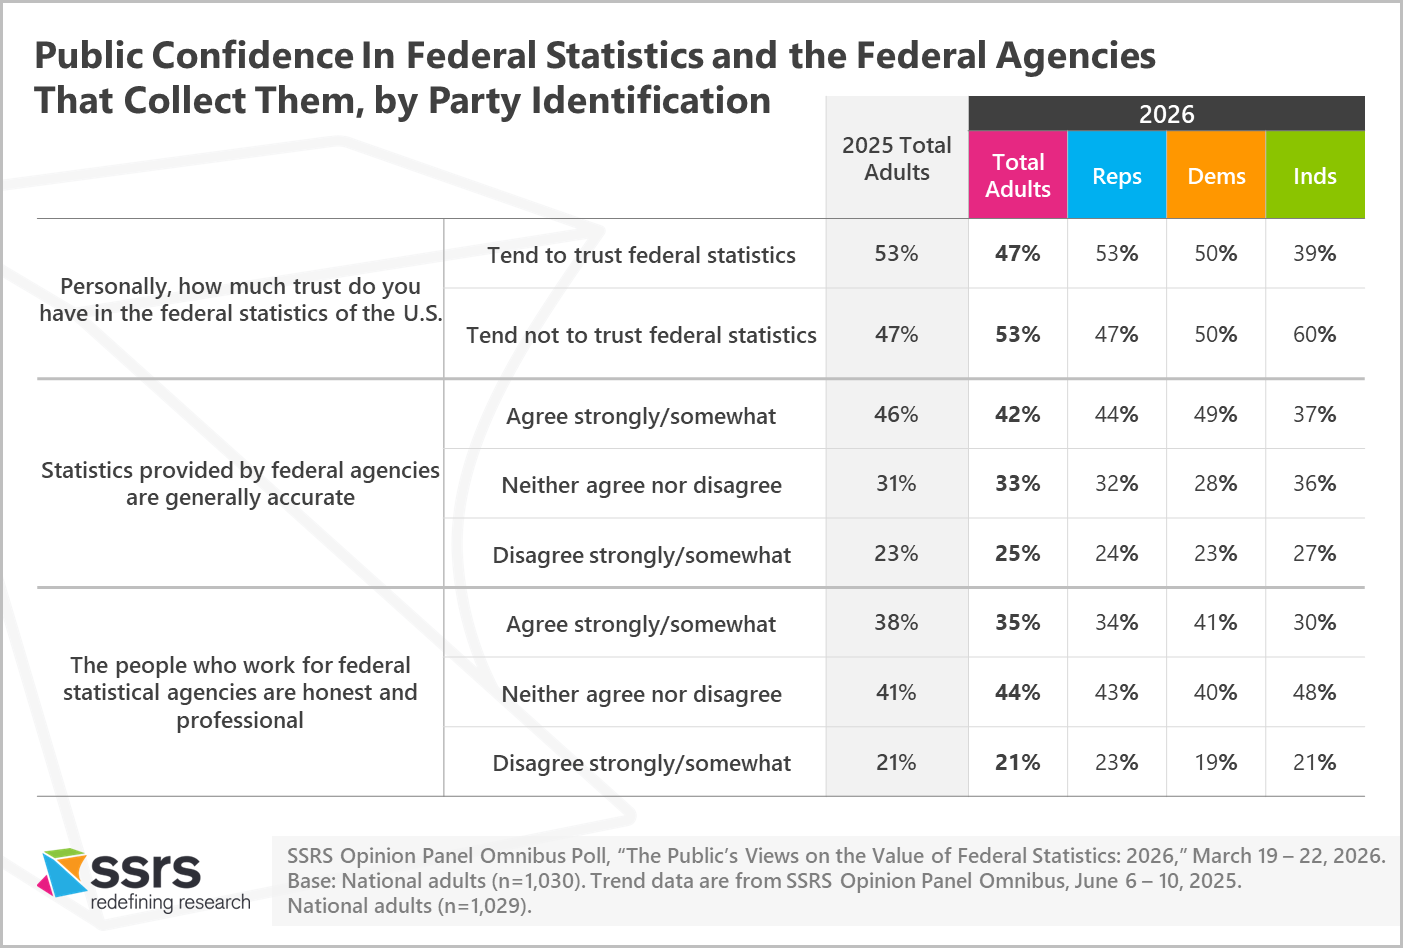
Accuracy of statistics provided by federal agencies. Also, in 2026, 42% agree with the statement that statistics provided by federal agencies are generally accurate; 25% disagree, and 33% neither agree nor disagree. Overall attitudes on this measure have not changed significantly since 2025.
Democrats (49%) are more likely than Independents (37%) to agree with the statement that statistics provided by federal agencies are generally accurate, with Republicans in between (44%). Liberals (52%) are more likely than Conservatives (44%) or Moderates (35%) to agree that these statistics are generally accurate.
Views about the honesty and professionalism of people who work for federal statistical agencies. In 2026, 35% agree with the statement that federal statistical agencies are honest and professional; 21% disagree, and 44% neither agree nor disagree. Overall attitudes on this measure have not changed significantly since 2025.
Democrats (41%) are more likely than Independents (30%), with Republicans in between (34%), to agree that the people who work for federal statistical agencies are honest and professional.
It is worth noting that more than three in ten U.S. adults report that they neither agree nor disagree with the statements about accuracy (33%) and honesty/professionalism (44%), which may indicate that they do not feel informed enough to respond or simply do not have an opinion one way or the other. Those who actually express an opinion one way or the other are more likely to agree than disagree that federal statistics are generally accurate (42% to 25%) and that people at federal statistical agencies are honest and professional (35% to 21%).
The Public’s Confidence in Government and the Media
The SSRS poll also asked U.S. adults about the level of confidence they have in five selected areas of government and the media. Public confidence federal statistics, the federal government, and state governments has declined from 2025 to 2026.
Confidence in federal statistics. About one in five (20%) report that they have a great deal or quite a lot of confidence in federal statistics, such as the unemployment rate, the population count, or obesity statistics, while 44% have some confidence, and 36% have very little or no confidence.
The proportion of U.S. adults who express a great deal or quite a lot of confidence in federal statistics has declined from 27% in 2025 to 20% in 2026, while the proportion reporting that they have very little or no confidence at all had risen from 29% to 36%.
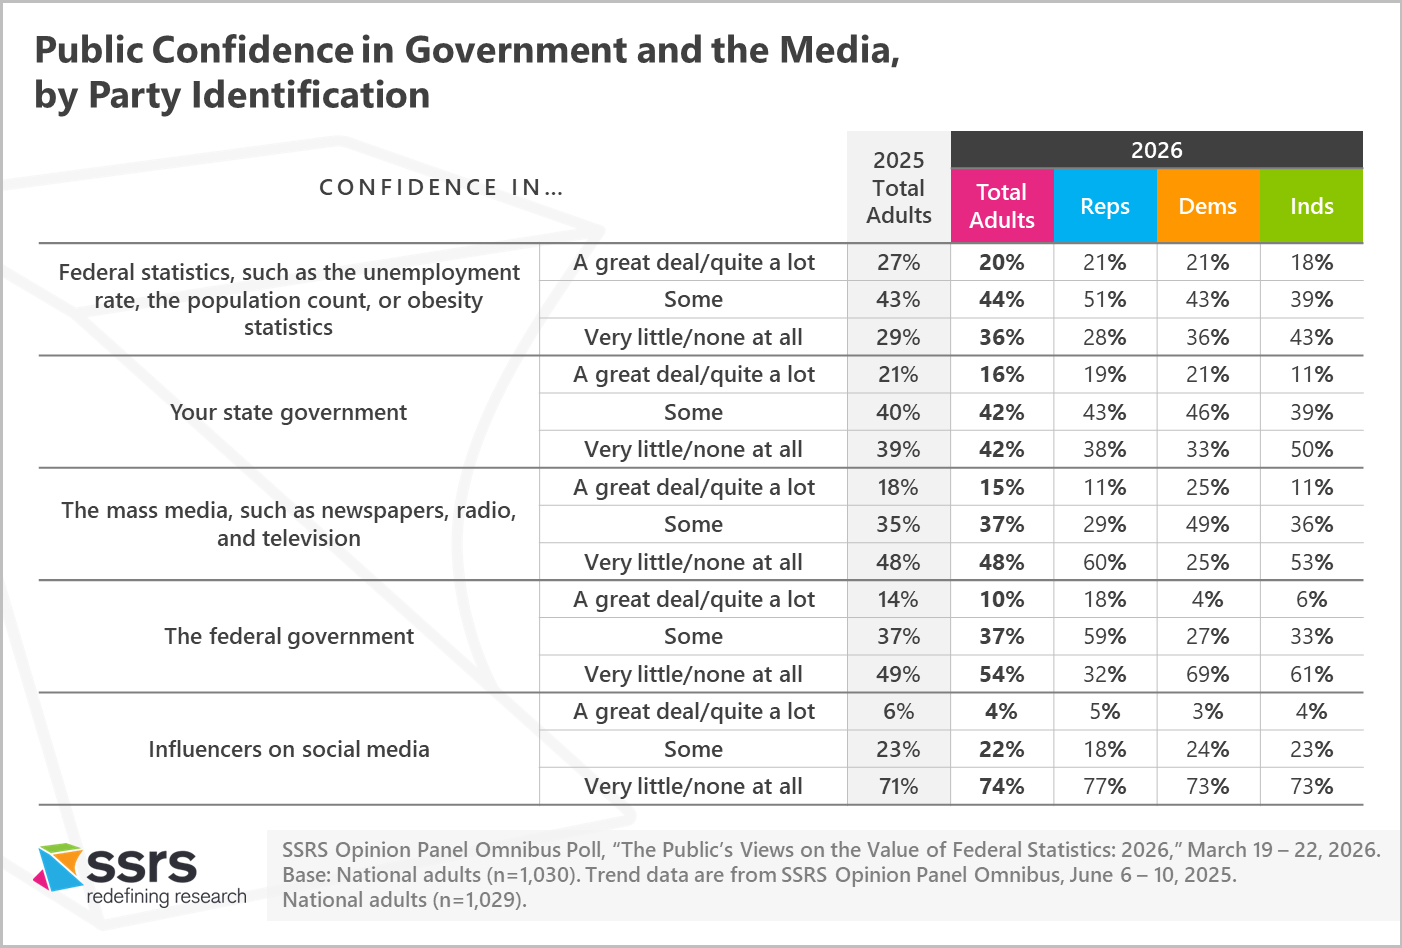
Current levels of confidence in federal statistics vary little among groups in the adult population. However, the proportion that expresses a great deal or quite a lot of confidence has declined from 25% in 2025 to 18% in 2026 among Independents, and from 33% in 2025 to 21% in 2026 among Democrats.
Currently, the group most likely to have very little or no confidence at all in federal statistics is Black adults (48%, compared to 34% of White adults).
Confidence in the federal government. About one in ten U.S. adults (10%) report that they have a great deal or quite a lot of confidence in the federal government, while 37% have some confidence, and 49% have very little or no confidence.
The proportion of U.S. adults who express a great deal or quite a lot of confidence in the federal government has declined from 14% in 2025 to 10% in 2026, while the proportion reporting that they have very little or no confidence at all had risen from 49% to 54%.
Currently, Democrats (69%) and Independents (61%) are significantly more likely than Republicans (32%) to say they have very little or no confidence in the federal government. Liberals (76%) are more likely than Moderates (54%) or Conservatives (37%) to have this low level of confidence
Confidence in your state government. About one in six (16%) say they have a great deal or quite a lot of confidence in their state government, while 42% have some confidence, and 42% have very little or no confidence.
The proportion of U.S. adults who express a great deal or quite a lot of confidence in their state government has declined from 21% in 2025 to 16% in 2026.
In 2026, Independents (50%) are more likely than Republicans (38%) or Democrats (33%) to have little or no confidence at all in their state government
Confidence in the mass media. Only 15% of U.S. adults report that they have a great deal or quite a lot of confidence in the mass media, such as newspapers, radio, and television, while 37% have some confidence, and 48% have very little or no confidence.
Overall, confidence in the mass media has not changed significantly over the past year.
Current levels of confidence in the mass media vary widely among groups. Republicans (60%) and Independents (53%) are significantly more likely than Democrats (25%) to express very little or no confidence in the mass media. Conservatives (62%) are almost twice as likely as Liberals (32%) to express very little or no confidence, and White adults (53%) are more likely than Black adults (38%) or Hispanic adults (42%).
Confidence in social influencers on social media. Only 4% say they have a great deal or quite a lot of confidence in influencers on social media. No major political or demographic groups among U.S. adults have much confidence in influencers on social media.
Who Uses Federal Statistics?
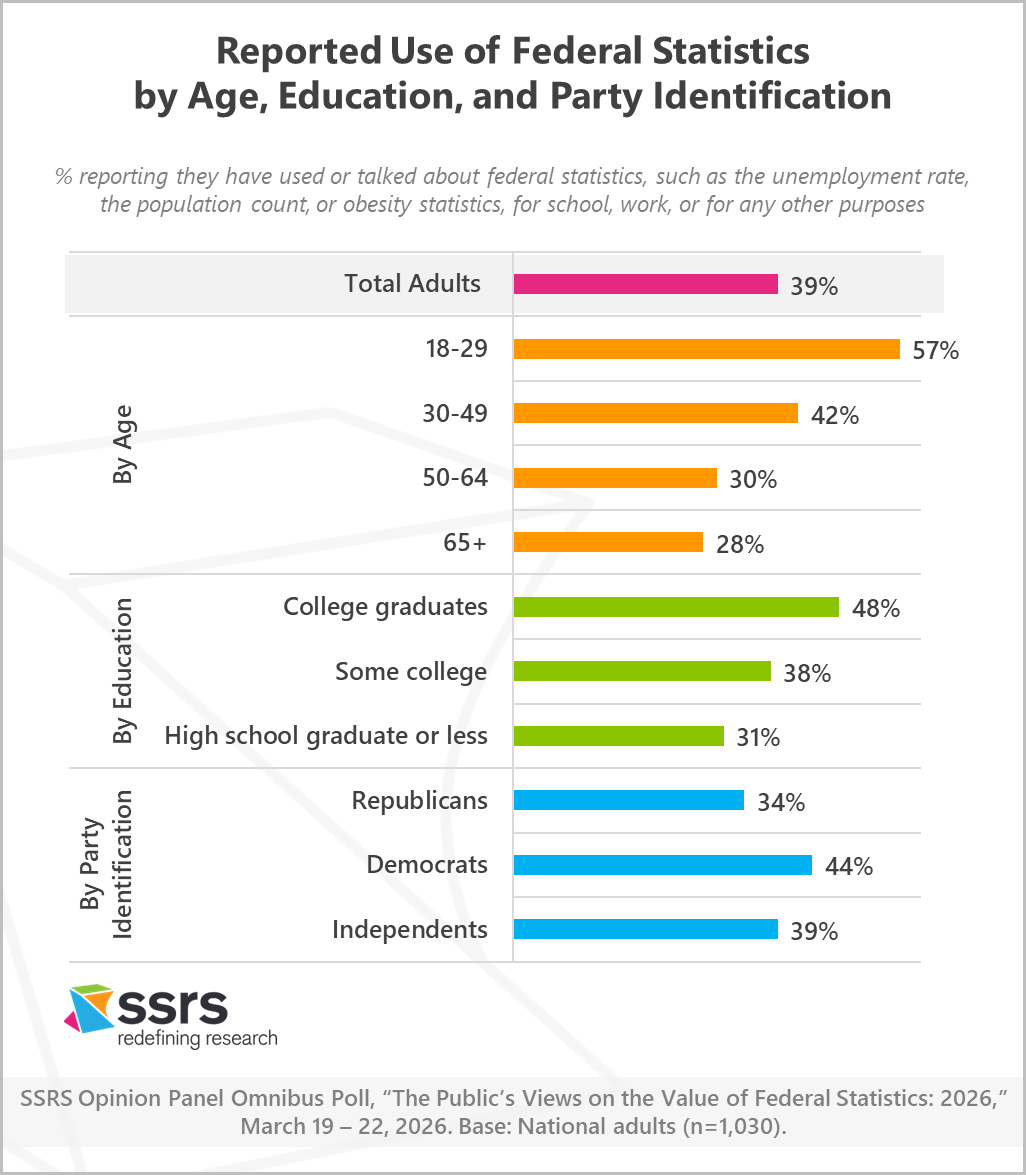
In the new SSRS poll, about four in ten U.S. adults (39%) report that they have used or talked about federal statistics, such as the unemployment rate, the population count, or obesity statistics, for school, work, or for any other purposes. Reported use of federal statistics is highest among adults aged 18-29 (57%) and college graduates (48%).
Reported use of federal statistics is higher among Democrats (44%) than Republicans (34%).
Overall, reported use of federal statistics has not changed significantly since 2025 (40%).
What Do U.S. Adults Say Is Their Main Source of News?
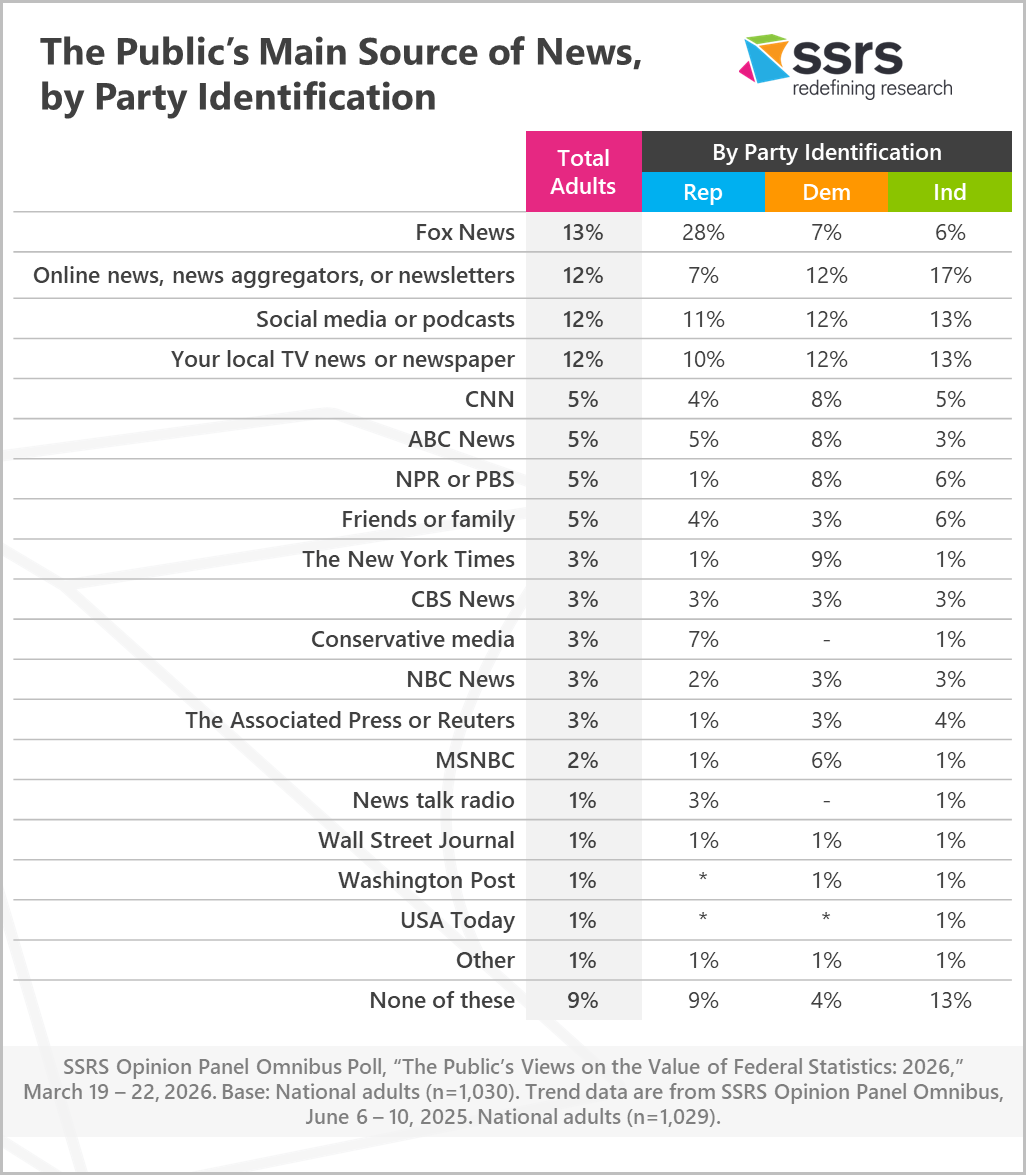
The new SSRS poll also finds that when asked to choose among 18 options, U.S. adults cite Fox News (13%), online news, news aggregators, or newsletters (12%), social media or podcasts (12%), and their local TV news or newspapers (12%) as their main source of news.
Overall, the pattern of news sources has not changed significantly since 2025.
Differences by party identification. The top four sources overall also appear among the most-cited news sources for Republicans, Democrats, and Independents. But beyond that, the main source of news varies considerably by party identification. Among Republicans, the top source is Fox News (28%), cited by only 7% of Democrats and 6% of Independents. Independents (17%) are more likely than Republicans (7%) to report that online news, news aggregators, or newsletters are their main source. In addition, only 4% of Democrats report that none of the 18 sources on the list are their main source (compared to 9% of Republicans and 13% of Independents).
Partisan differences also appear for sources further down the overall list. Republicans (7%) are more likely than Democrats or Independents to choose conservative media as the main sources of news. Democrats are more likely than Republicans to choose The New York Times (9% to 1%), NPR or PBS (8% to 1%), and CNN (8% to 4%).
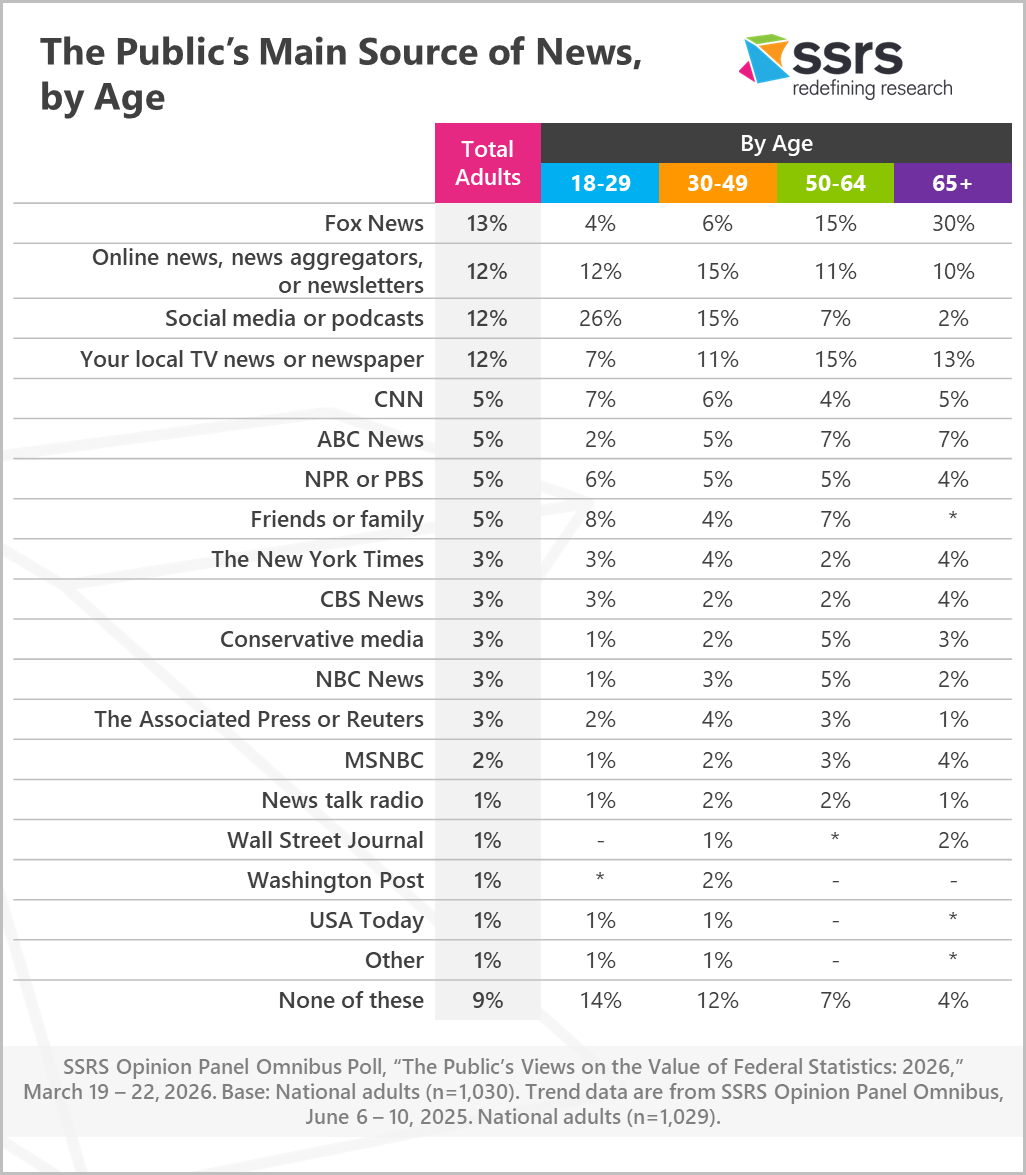
Differences by age. Reliance on social media or podcasts as their main source of news is significantly higher among younger than older adults: 26% of 18-29-year-olds and 15% of 30-49-year-olds report that social media or podcasts are their main source, compared with only 7% of adults aged 50-64 and 2% of those aged 65 or over. Younger adults are also more likely to report that none of the 18 choices are their main source of news: 13% of 18-49-year-olds, 6% of those aged 50 or over.
Adults aged 65 or over are significantly more likely than other age groups to cite Fox News (30%) as their top source.
Read the Findings from the 2025 Report >>
Methodology
Interviews for this study were conducted on the SSRS Opinion Panel Omnibus on March 19 – 22, 2026, among a nationally representative sample of 1,030 respondents aged 18 and older. The margin of error for total respondents is +/-3.0 percentage points at the 95% confidence level. The design effect is 1.26. View the topline >>
Trend data are from SSRS Opinion Panel Omnibus, June 6 – 10, 2025. National adults (n=1,029).
The SSRS Opinion Panel Omnibus is a multi-client, probability-based survey that fields twice a month. It delivers a nationally representative sample of 1,000 adults aged 18 or older in English (with Spanish language option). Data collection is conducted online and via phone (for non-internet and web-reluctant respondents) using the probability-based SSRS Opinion Panel.
All SSRS Opinion Panel Omnibus data are weighted to represent the target population of U.S. adults ages 18 or older. View the questions used for this analysis, along with the responses (topline).
The SSRS Opinion Panel Omnibus is conducted on the SSRS Opinion Panel. SSRS Opinion Panel members are recruited randomly based on a nationally representative ABS (Address Based Sample) design (including Hawaii and Alaska). ABS respondents are randomly sampled by Marketing Systems Group (MSG) through the U.S. Postal Service’s Computerized Delivery Sequence File (CDS), a regularly updated listing of all known addresses in the U.S. For the SSRS Opinion Panel, known business addresses are excluded from the sample frame.
The SSRS Opinion Panel is a multi-mode panel (web and phone). Most panelists take self-administered web surveys; however, the option to take surveys conducted by a live telephone interviewer is available to those who do not use the internet as well as those who use the internet but are reluctant to take surveys online. All sample drawn for this study were SSRS Opinion Panelists who are U.S. adults ages 18 or older. Sample was selected to ensure representation by age, gender, race and ethnicity, education, Census region, and party identification. Possible sources of non-sampling error include non-response bias, as well as question wording and ordering effects.