
As economic uncertainty continues to shape how Americans think, feel, and make decisions, staying ahead of shifting attitudes has never been more critical. In the sixth wave of the SSRS Economic Attitudes Tracker, we take a closer look at the latest shifts in public sentiment, revealing not just where Americans stand today but also how key dynamics are beginning to shift beneath the surface.
Drawing on data from our nationally representative, probability‑based SSRS Opinion Panel, this wave highlights four key trends emerging across the economic landscape.
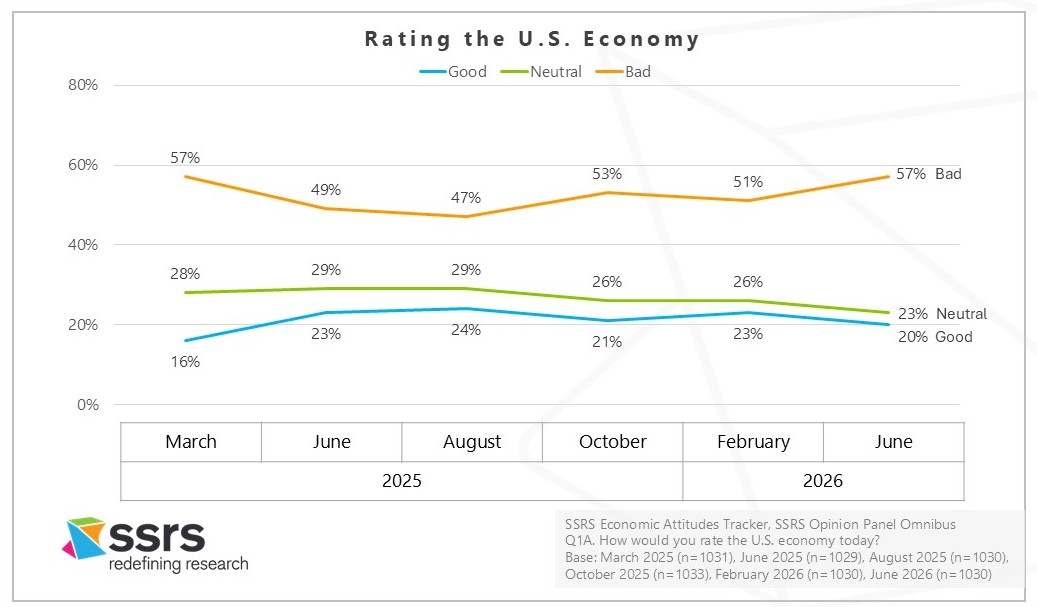
1. Pessimism about the economy is rising and has returned to March 2025 levels.
In June 2026, 57% of Americans rate the U.S. economy as bad, up 6% from February 2026.

2. For the first time since SSRS launched the Economic Attitudes Tracker, older generations are driving the increased pessimism in the U.S. economy.
The share of Gen X who rate the economy “bad” rose from 48% in February 2026 to 60% in June 2026, a 12-percentage-point increase, while the share of Baby Boomers who rate the economy “bad” rose from 38% to 53% in the same period, a 15-percentage-point increase.
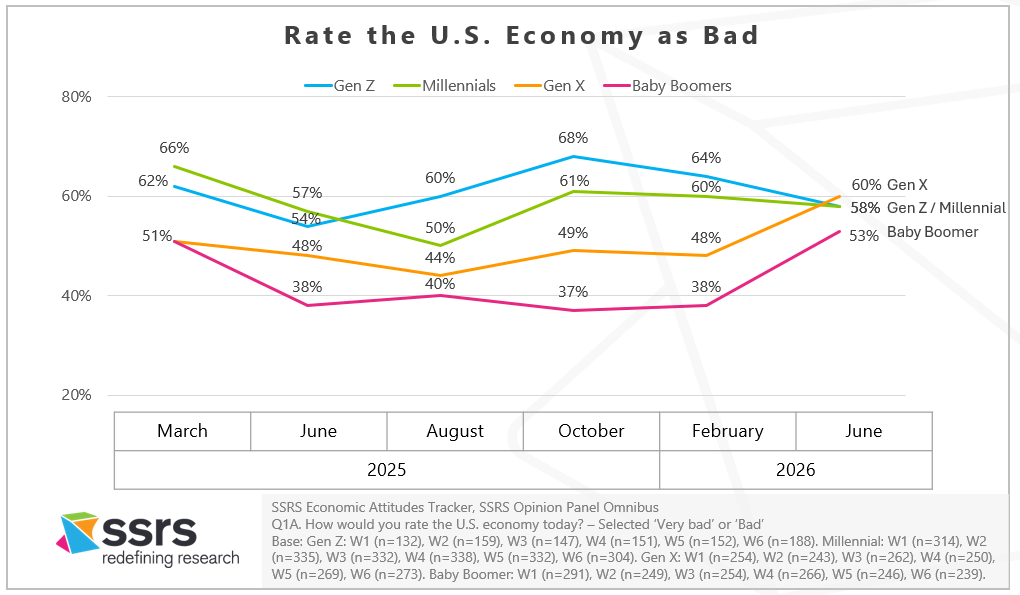
*In 2026, Gen Z ages 18-29, Millennials ages 30-45, Gen X ages 46-61, and Baby Boomers ages 62-80
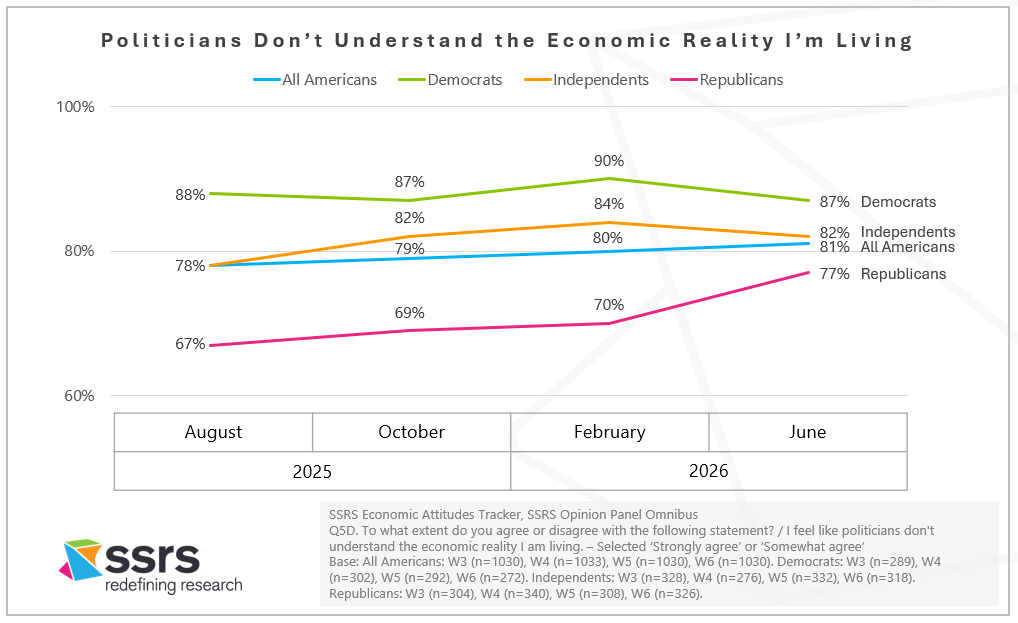
3. Republicans are feeling less understood by politicians when it comes to their economic reality.
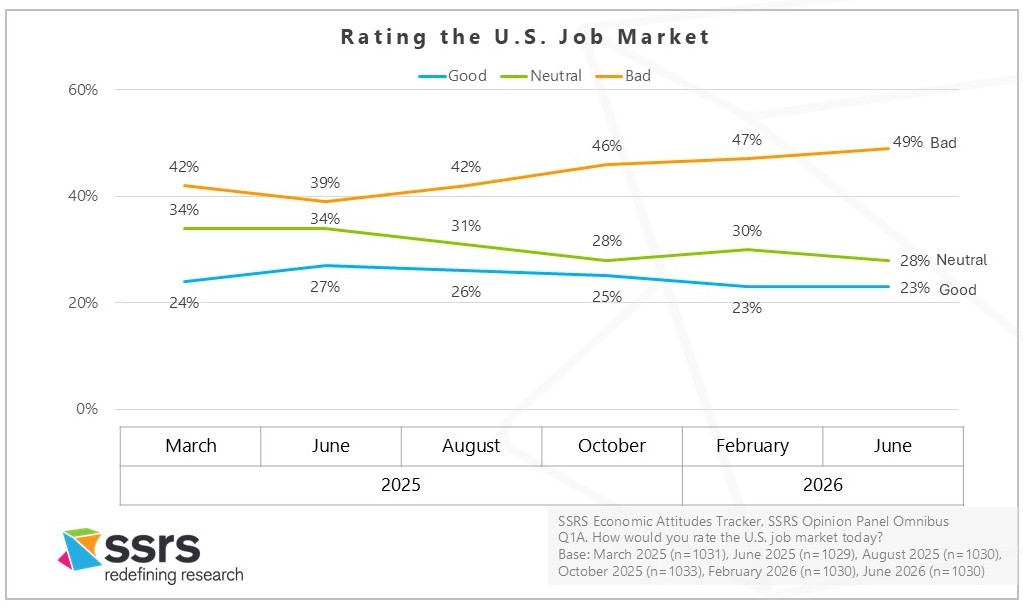
4. Assessments of the U.S. job market continue to decline.
Since June 2025, the share of U.S. adults who rate the U.S. job market as bad has increased by 10 percentage points, from 39% to 49%.
From changes in who is driving economic pessimism to evolving views of the job market and growing concerns about opportunity and representation. Together, these trends offer a clearer view into how Americans are navigating an increasingly complex environment and what we should be watching closely in the months ahead.
Join Our Economic Trends Mailing List
Methodology
The Economic Attitudes Tracker is conducted by SSRS on its Opinion Panel Omnibus platform. The SSRS Opinion Panel Omnibus is a national, twice-per-month, probability-based survey.
Economic Attitudes Tracker waves include:
- March 21 – March 24, 2025, among a sample of 1,031 panelists. The survey was conducted via web (n=1,001) and telephone (n=30) and administered in English (n=1,005) and Spanish (n=26). The margin of error for total respondents is +/-3.8 percentage points at the 95% confidence level. The design effect is 1.54.
- June 6 – June 10, 2025, among a sample of 1,029 respondents. The survey was conducted via web (n=999) and telephone (n=30) and administered in English (n=1,004) and Spanish (n=25). The margin of error for total respondents is +/-3.5 percentage points at the 95% confidence level. The design effect is 1.29.
- August 1 – August 4, 2025, among a sample of 1,030 respondents. The survey was conducted via web (n=1,000) and telephone (n=30) and administered in English (n=1,004) and Spanish (n=26). The margin of error for total respondents is +/-3.5 percentage points at the 95% confidence level. The total sample design effect for this survey is 1.31.
- October 16 – October 19, 2025, among a sample of 1,033 respondents. The survey was conducted via web (n=1,003) and telephone (n=30) and administered in English (n=1,007) and Spanish (n=26). The margin of error for total respondents is +/-3.5 percentage points at the 95% confidence level. The total sample design effect for this survey is 1.34. SSRS recontacted five respondents from the Omnibus survey to invite them to participate in a qualitative in-depth follow-up interview. Each interview lasted 30-minutes and was conducted over Zoom with an SSRS researcher between October 28 – 30, 2025.
- February 5 – February 9, 2026, among a sample of 1,030 respondents. The survey was conducted via web (n=1,000) and telephone (n=30) and administered in English (n=1,004) and Spanish (n=26). The margin of error for total respondents is +/-3.4 percentage points at the 95% confidence level. The total sample design effect for this survey is 1.26.
- June 18 – June 22, 2026 among a sample of 1,030 respondents. The survey was conducted via web (n=1,000) and telephone (n=30) and administered in English (n=1,004) and Spanish (n=26). The margin of error for total respondents is +/-3.4 percentage points at the 95% confidence level. The total sample design effect for this survey is 1.24.
All SSRS Opinion Panel Omnibus data are weighted to represent the target population of U.S. adults ages 18 or older.
The SSRS Opinion Panel Omnibus is conducted on the SSRS Opinion Panel. SSRS Opinion Panel members are recruited randomly based primarily on nationally representative ABS (Address Based Sample) design (including Hawaii and Alaska). ABS respondents are randomly sampled by Marketing Systems Group (MSG) through the U.S. Postal Service’s Computerized Delivery Sequence File (CDS), a regularly updated listing of all known addresses in the U.S. For the SSRS Opinion Panel, known business addresses are excluded from the sample frame. Additional panelists are recruited via random digit dial (RDD) telephone sample of cell phone numbers connected to a prepaid cell phone. This sample is selected by MSG from the cell phone RDD frame using a flag that identifies prepaid numbers. Prepaid cell numbers are associated with cell phones that are “pay as you go” and do not require a contract.
The SSRS Opinion Panel is a multi-mode panel (web and phone). Most panelists take self-administered web surveys; however, the option to take surveys conducted by a live telephone interviewer is available to those who do not use the internet as well as those who use the internet but are reluctant to take surveys online.