
As economic headlines shift week to week, Americans’ views on the economy tell a deeper story. The SSRS Economic Attitudes Tracker has been tracking this story as it develops since March 2025. Each wave captures how economic perceptions and inflation pressures are shaping Americans’ financial behavior, outlook, and trust in the country’s leadership.
The fourth wave was conducted in October 2026 and fielded using the SSRS Opinion Panel Omnibus, a nationally representative, probability-based survey of U.S. adults.
Findings from the SSRS Economic Tracker – October 2026
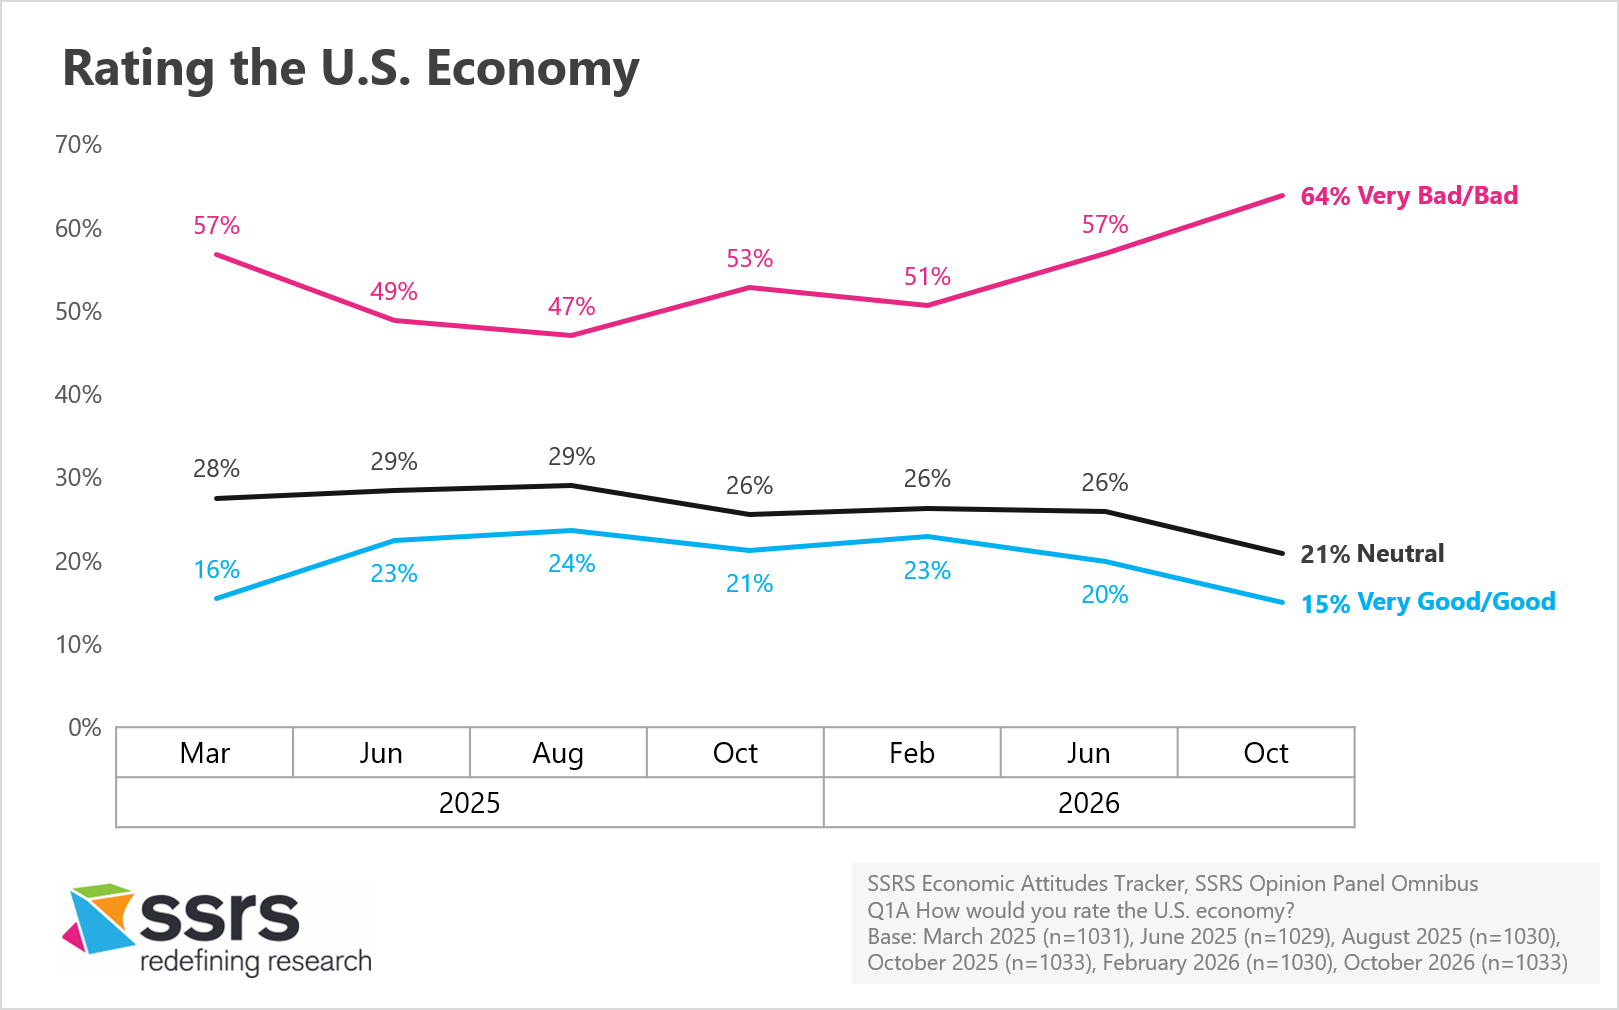
As the 2026 midterm election approaches, Americans’ views of the economy are increasingly negative.
The share of Americans who rate the U.S. economy poorly has reached its highest level since SSRS launched the Economic Attitudes Tracker in early 2025. About two-thirds (64%) describe the economy as ‘very bad’ or ‘bad”—up seven percentage points from June 2026 and 11 points from this time last year.
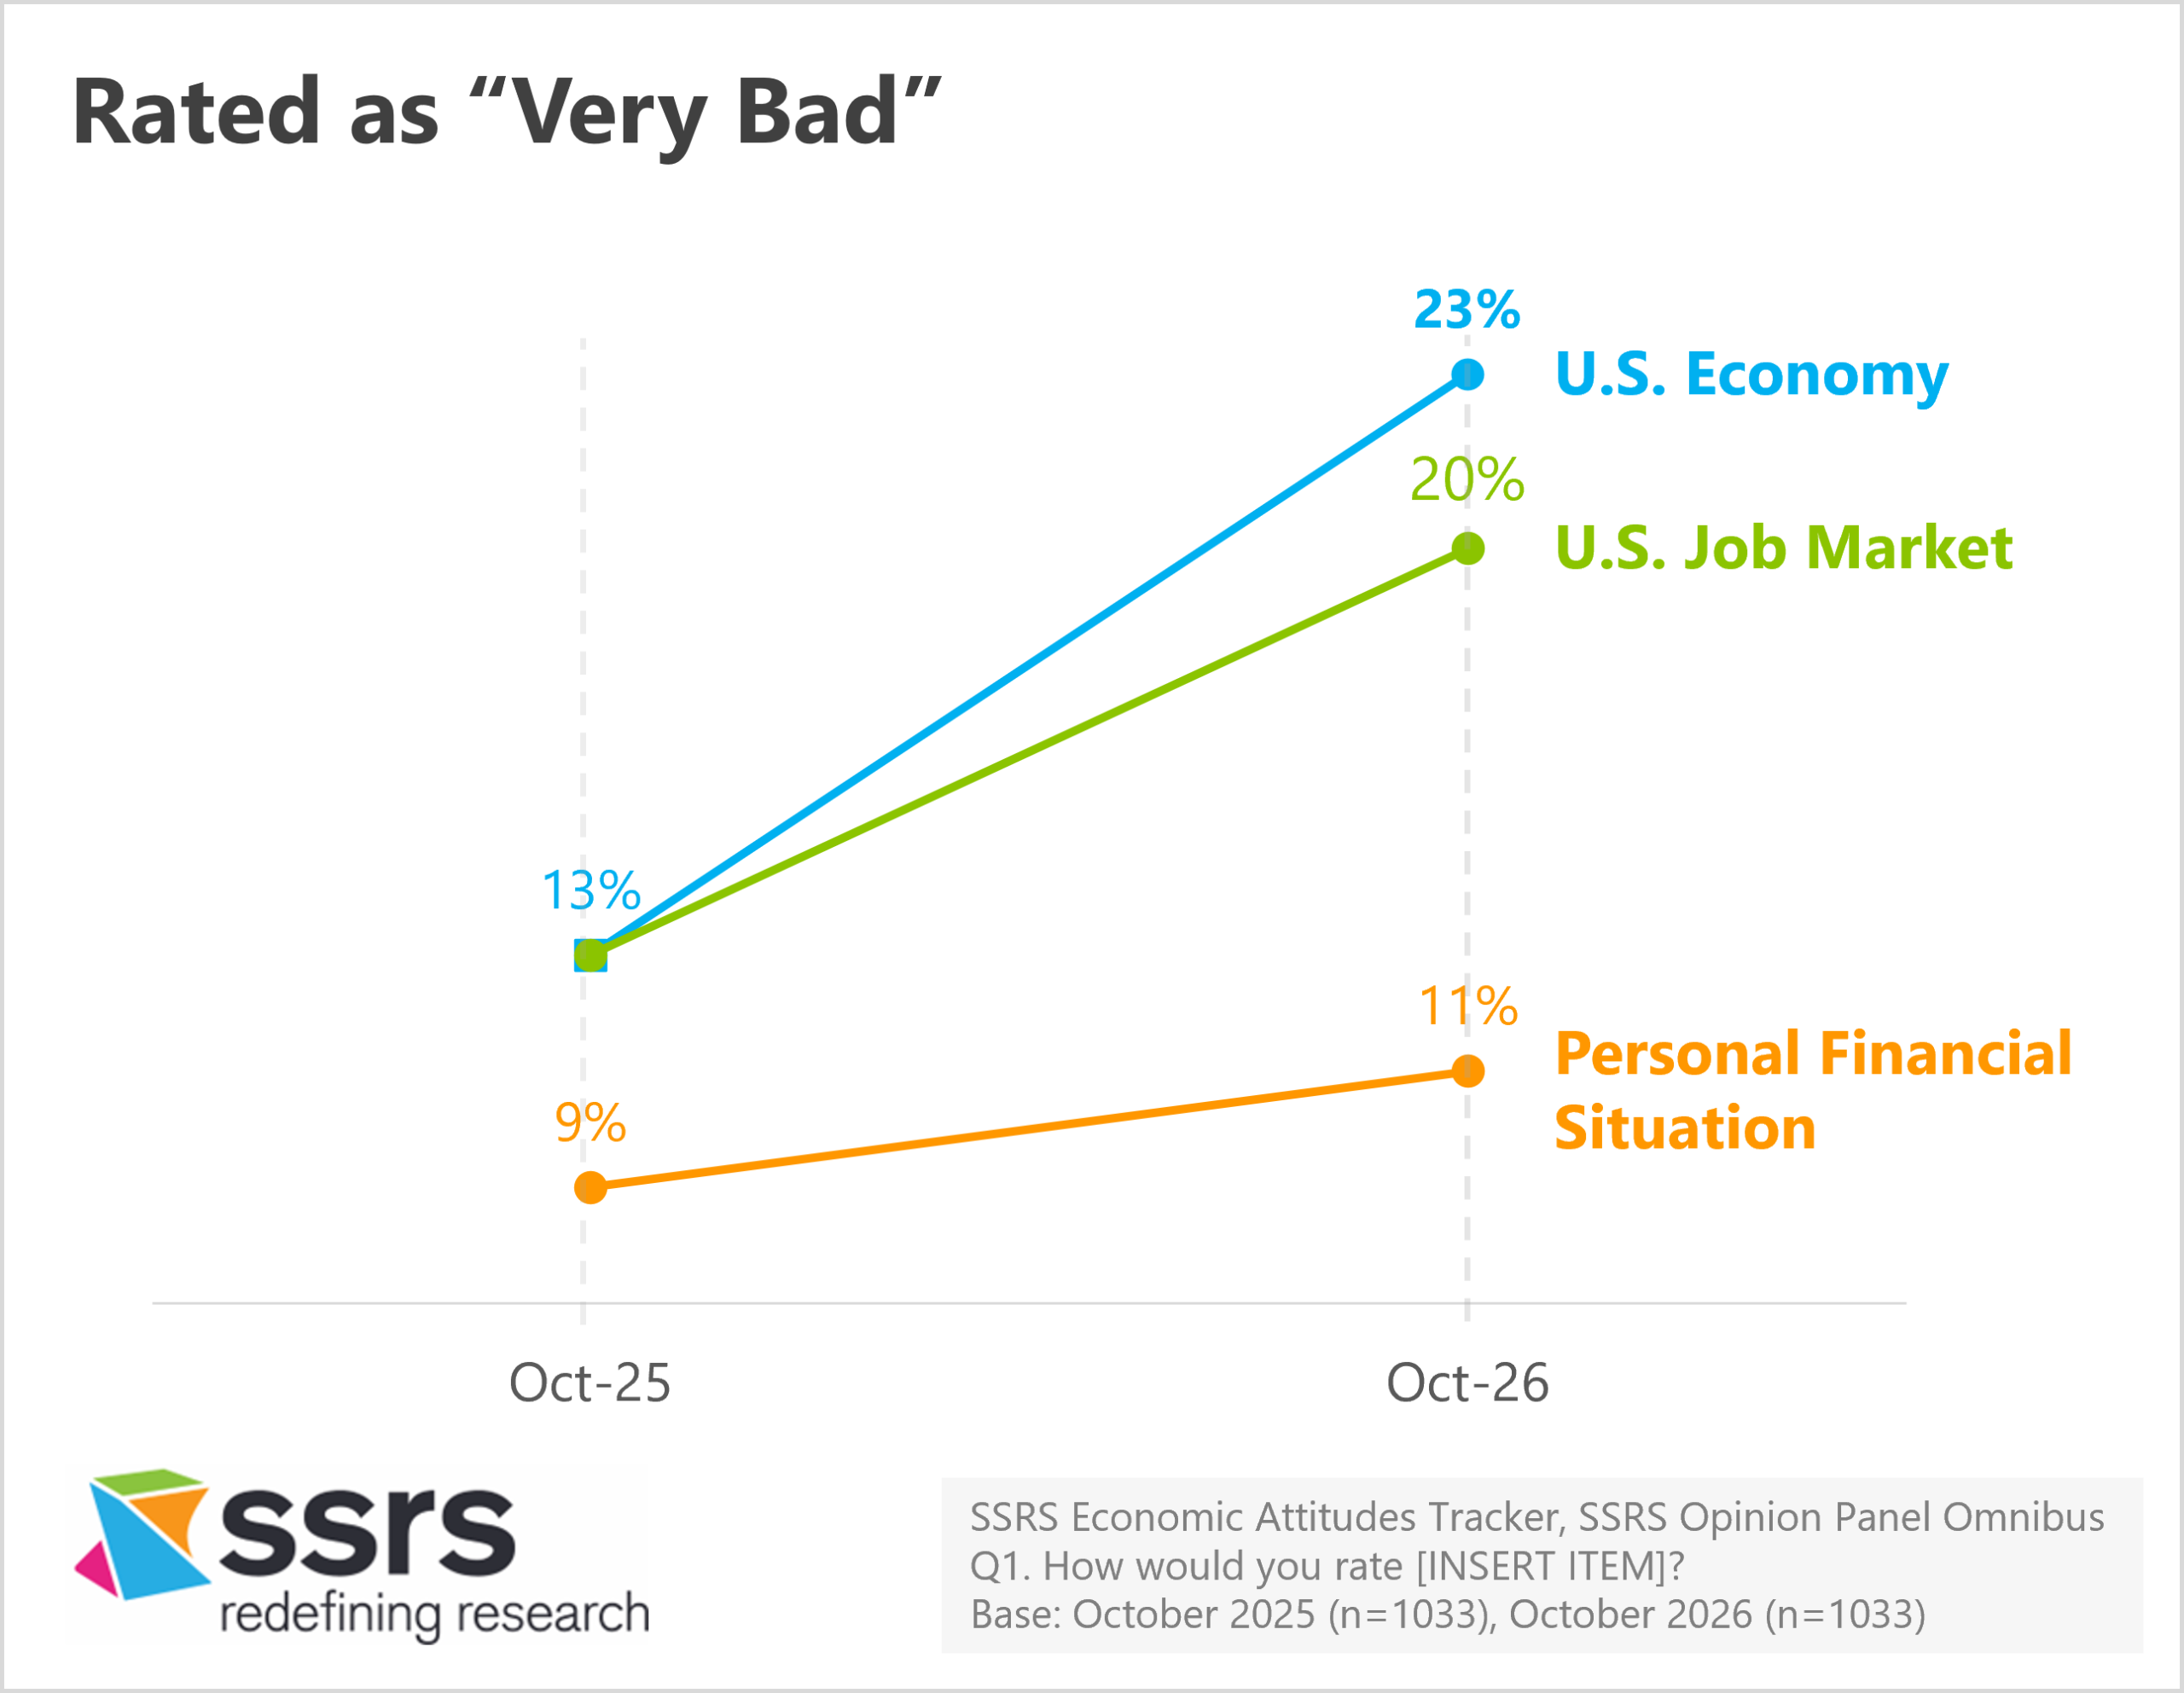
The share rating the economy “very bad” has also risen significantly. About one in four Americans (23%) now hold this view, up 10 points from last October. The percent rating the U.S. job market as “very bad” has also increased significantly over that time.
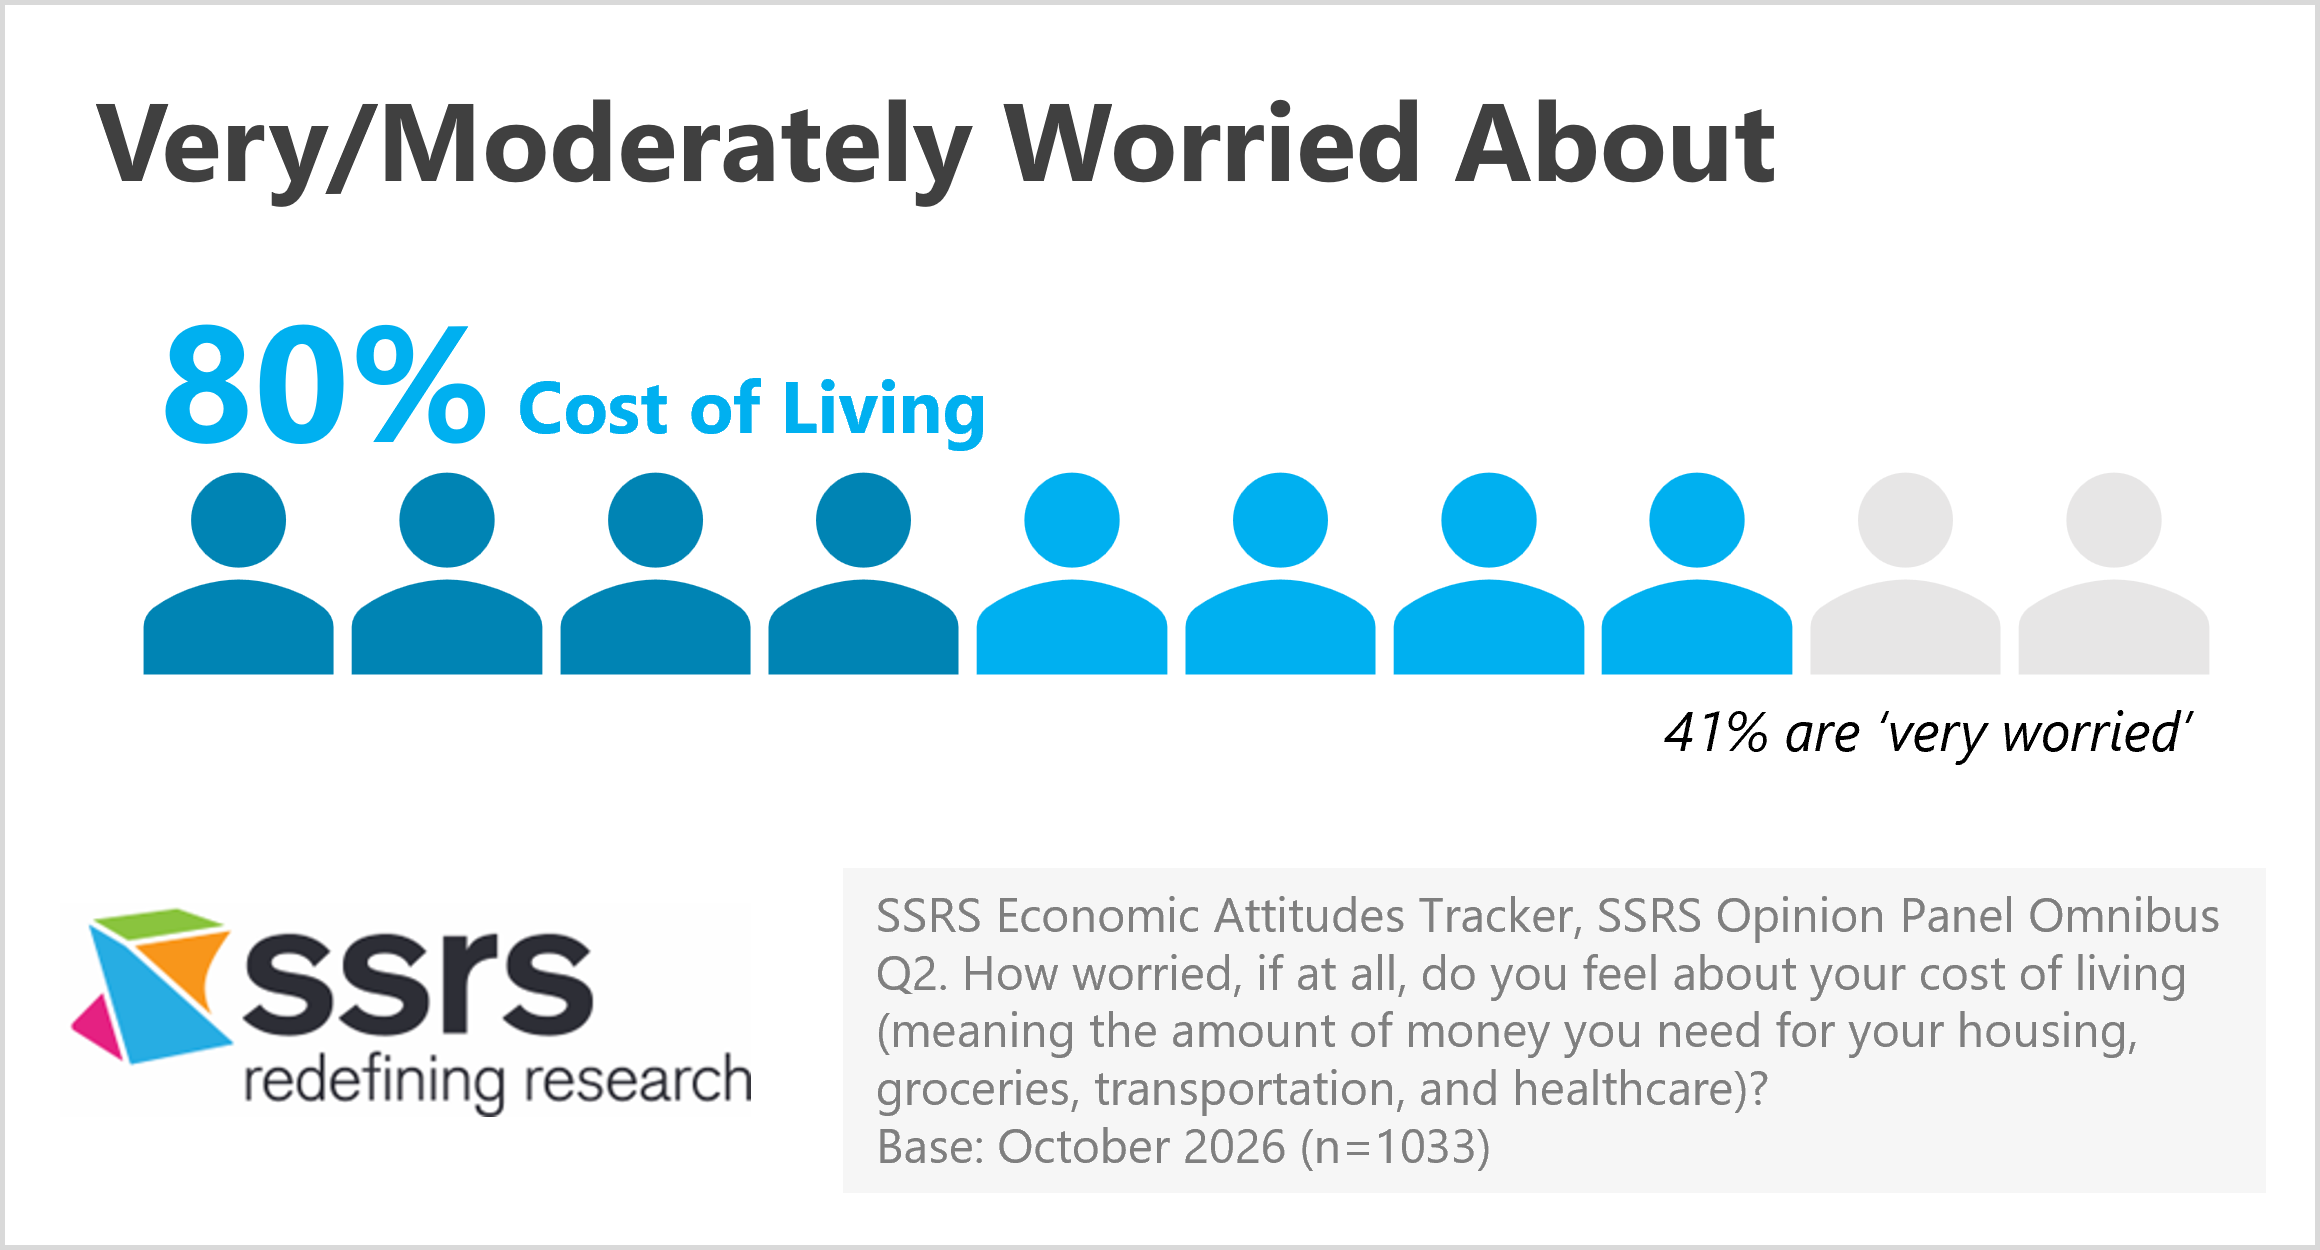
The cost of living is a significant concern for Americans. Four in five (80%) are at least moderately worried about rising costs, including two in five (41%) who are very worried.
As costs rise, Americans are adjusting by cutting back and making daily sacrifices. These include:
- Turning down the heat or air conditioning, or using fewer appliances, to reduce utility bills (64%)
- Sticking to a grocery budget (59%)
- Spending less on extras and entertainment (58%)
- Traveling less than planned or less than usual (46%)
- Driving less to spend less on gas (46%)
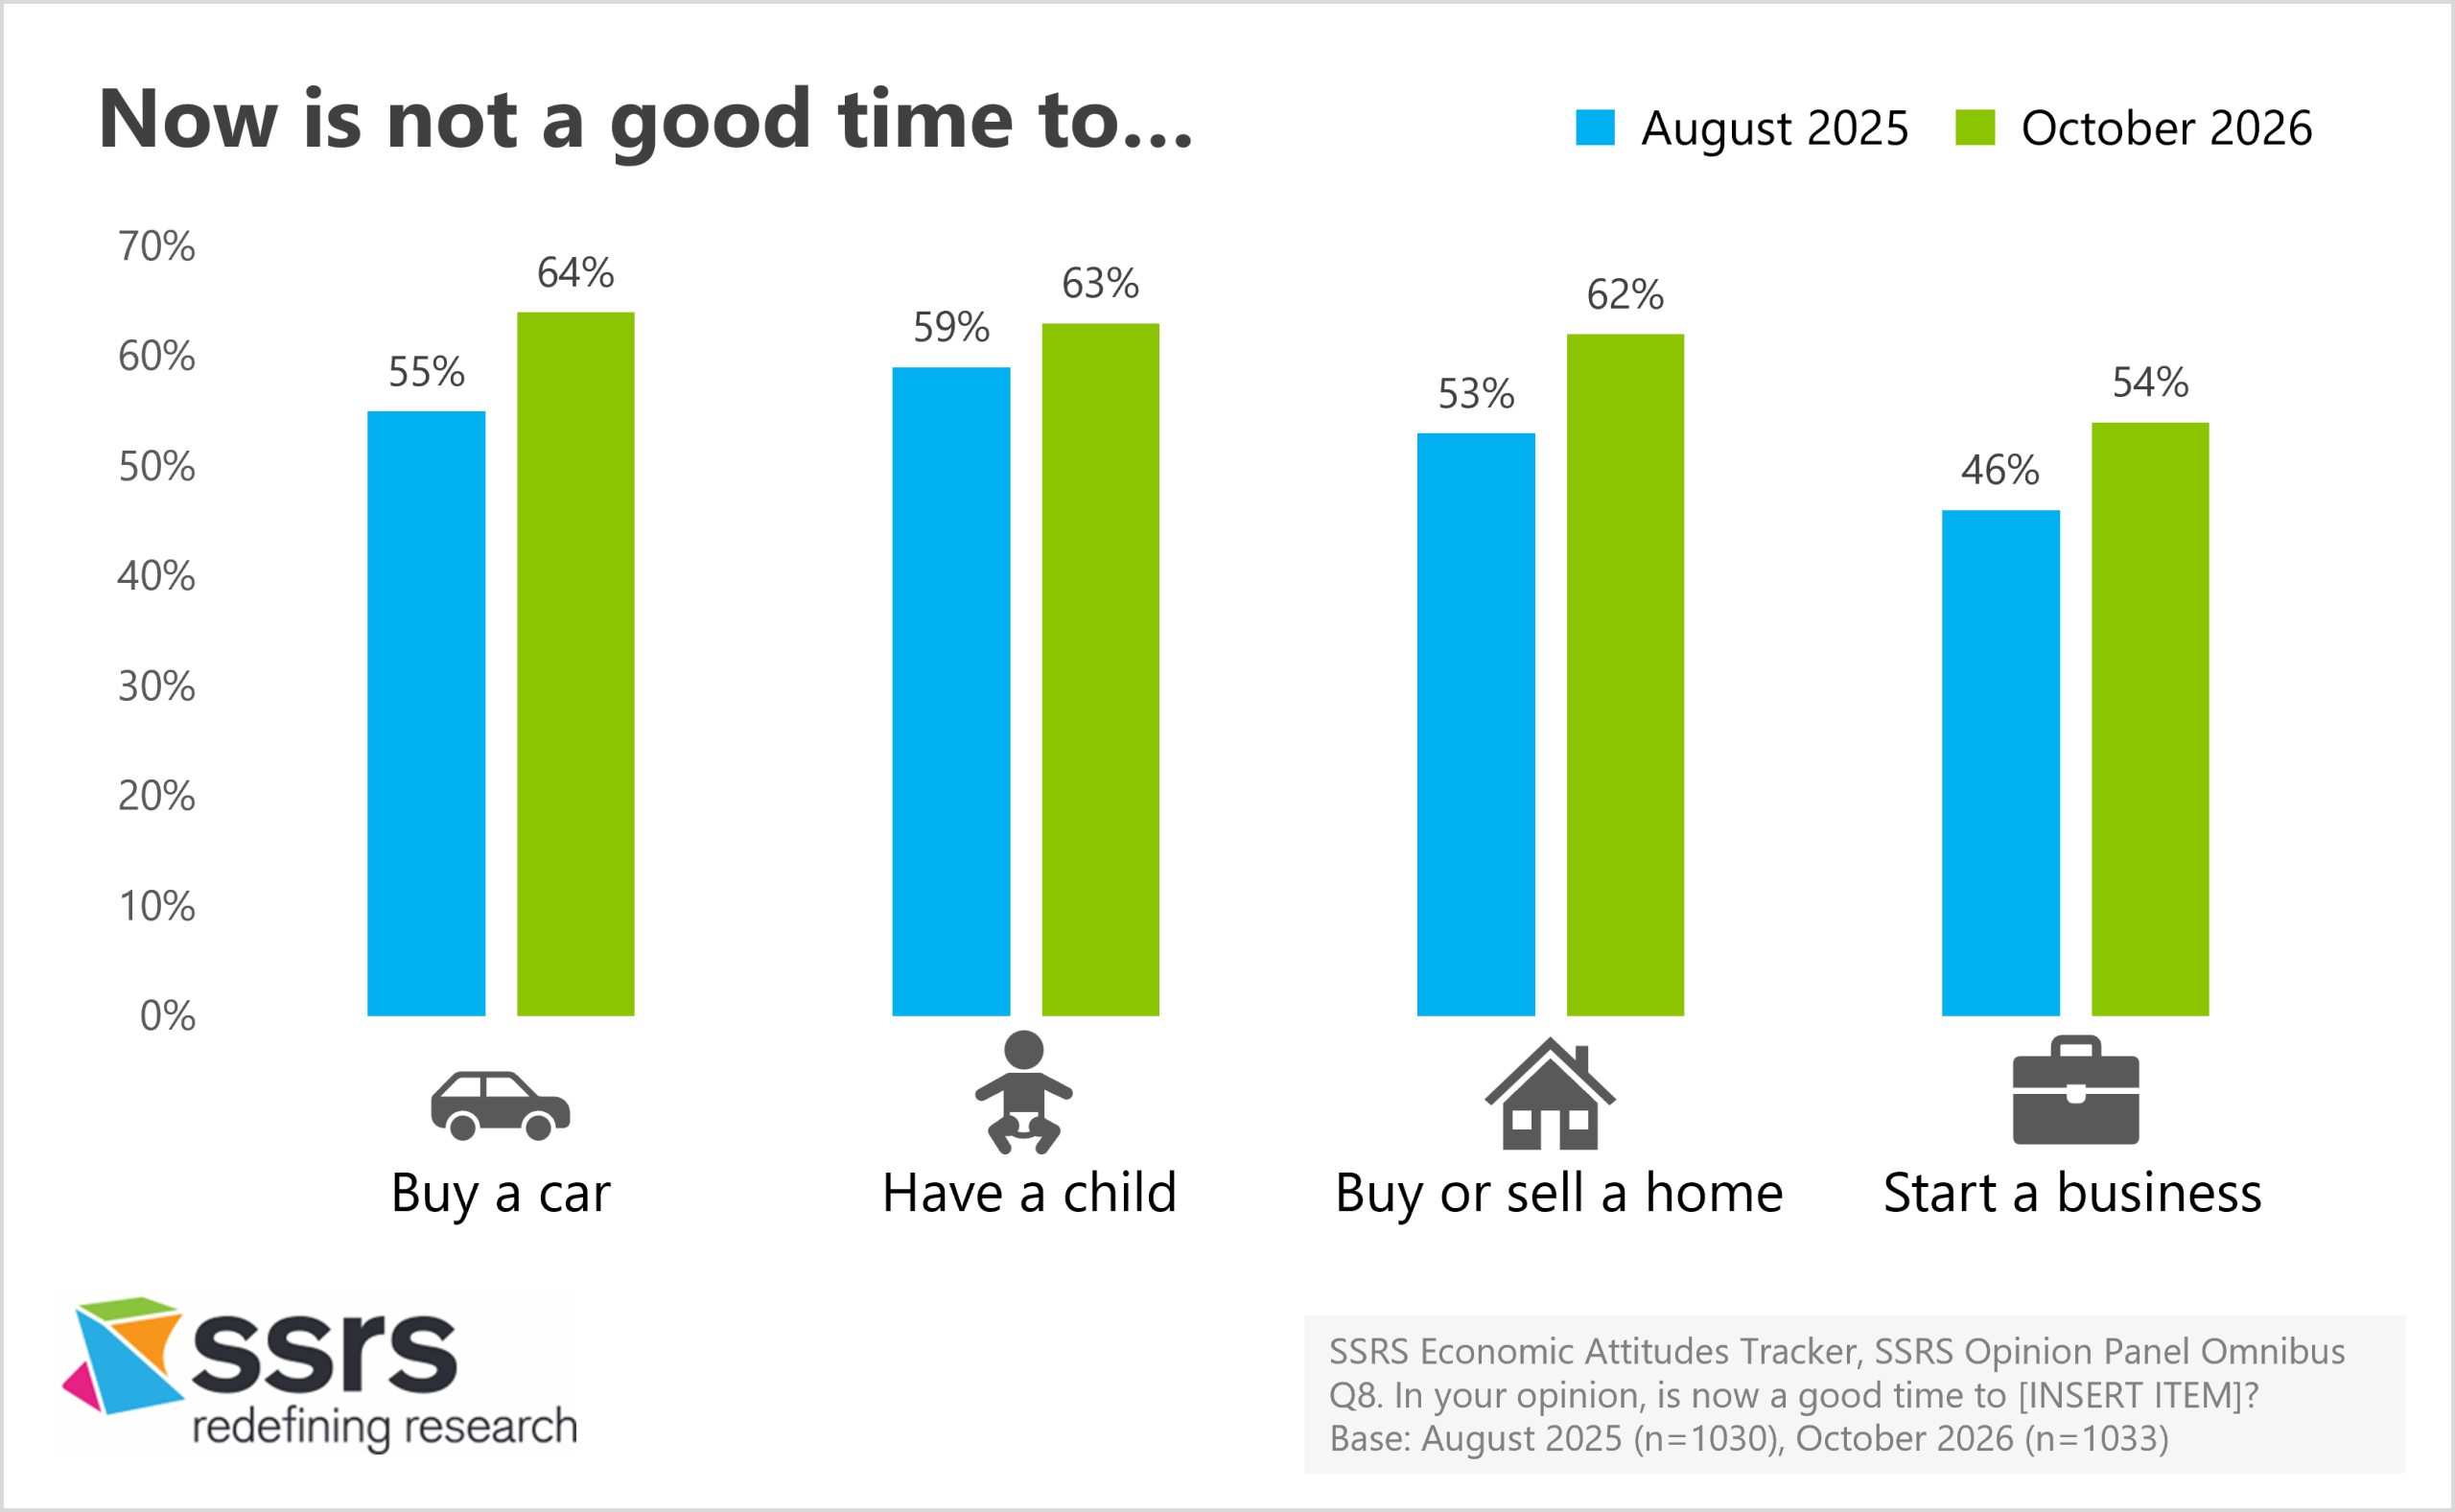
Looking at the bigger picture, Americans are cautious about whether now is the right time to make major life decisions or big-ticket purchases.
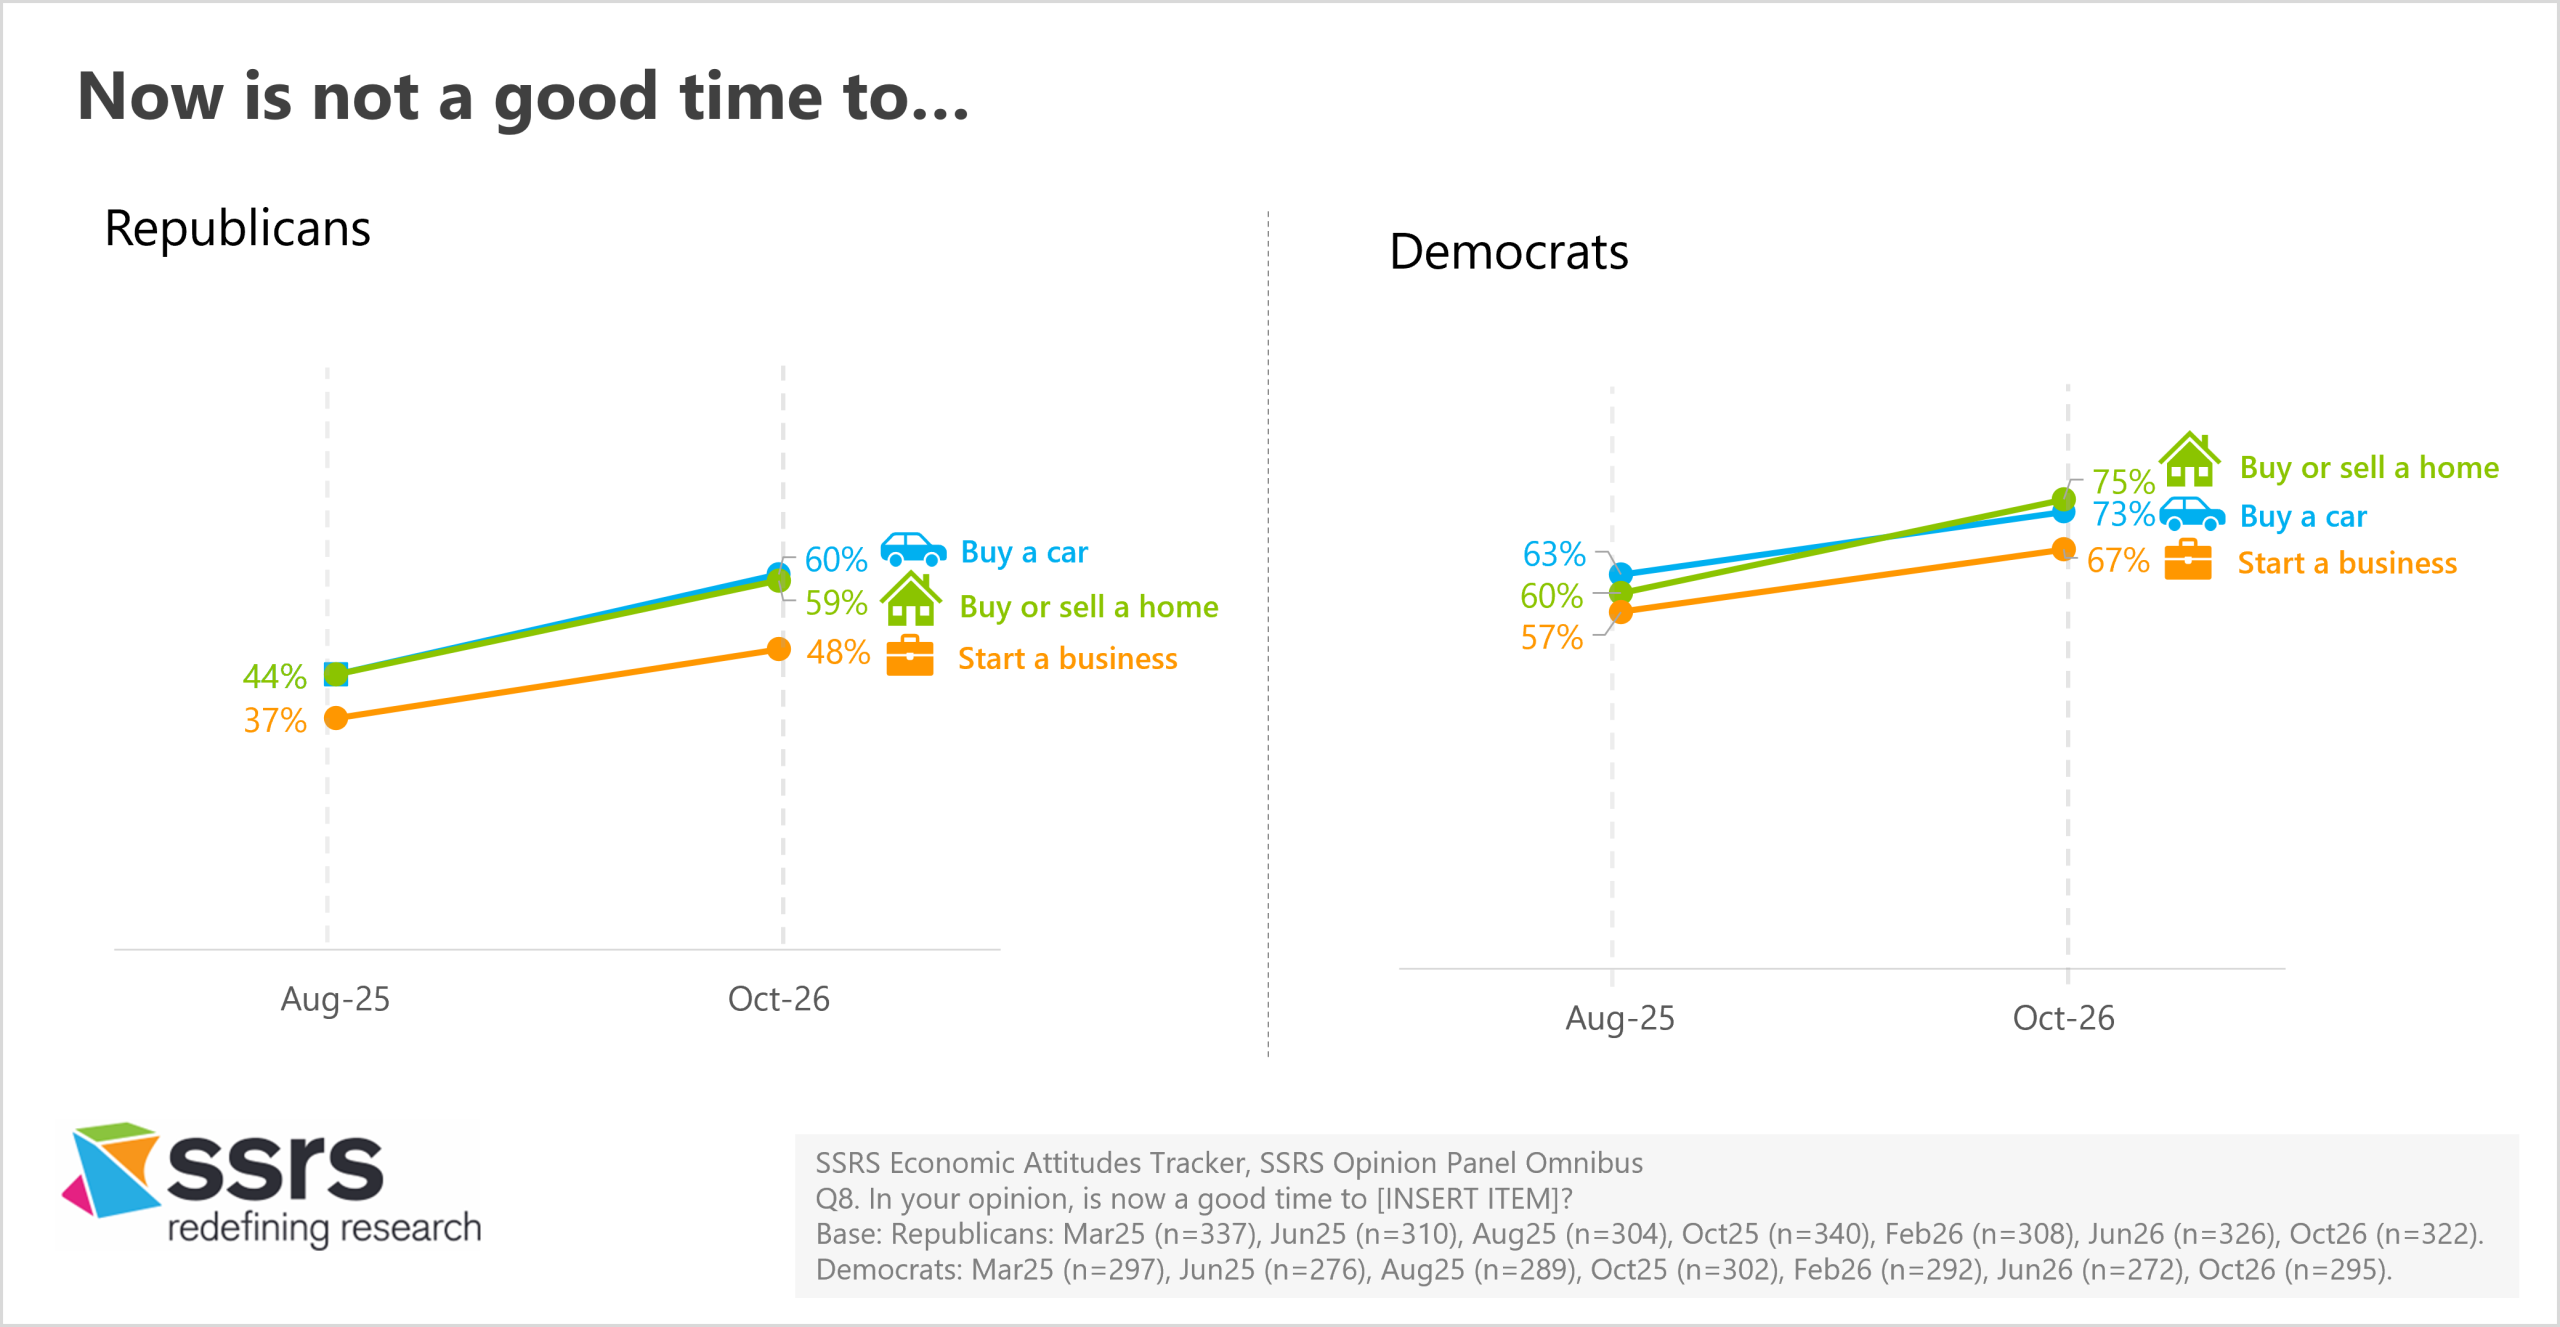
Most say it’s not a good time to buy a car (64%), have a child (63%), buy or sell a home (62%), or start a business (54%). Since August 2025, the share who say it’s not a good time for the major financial investments asked about has increased significantly.
Younger generations are especially cautious about having children. Seven in 10 Gen Z adults (71%) and Millennials (70%) say now is not a good time to have a child.
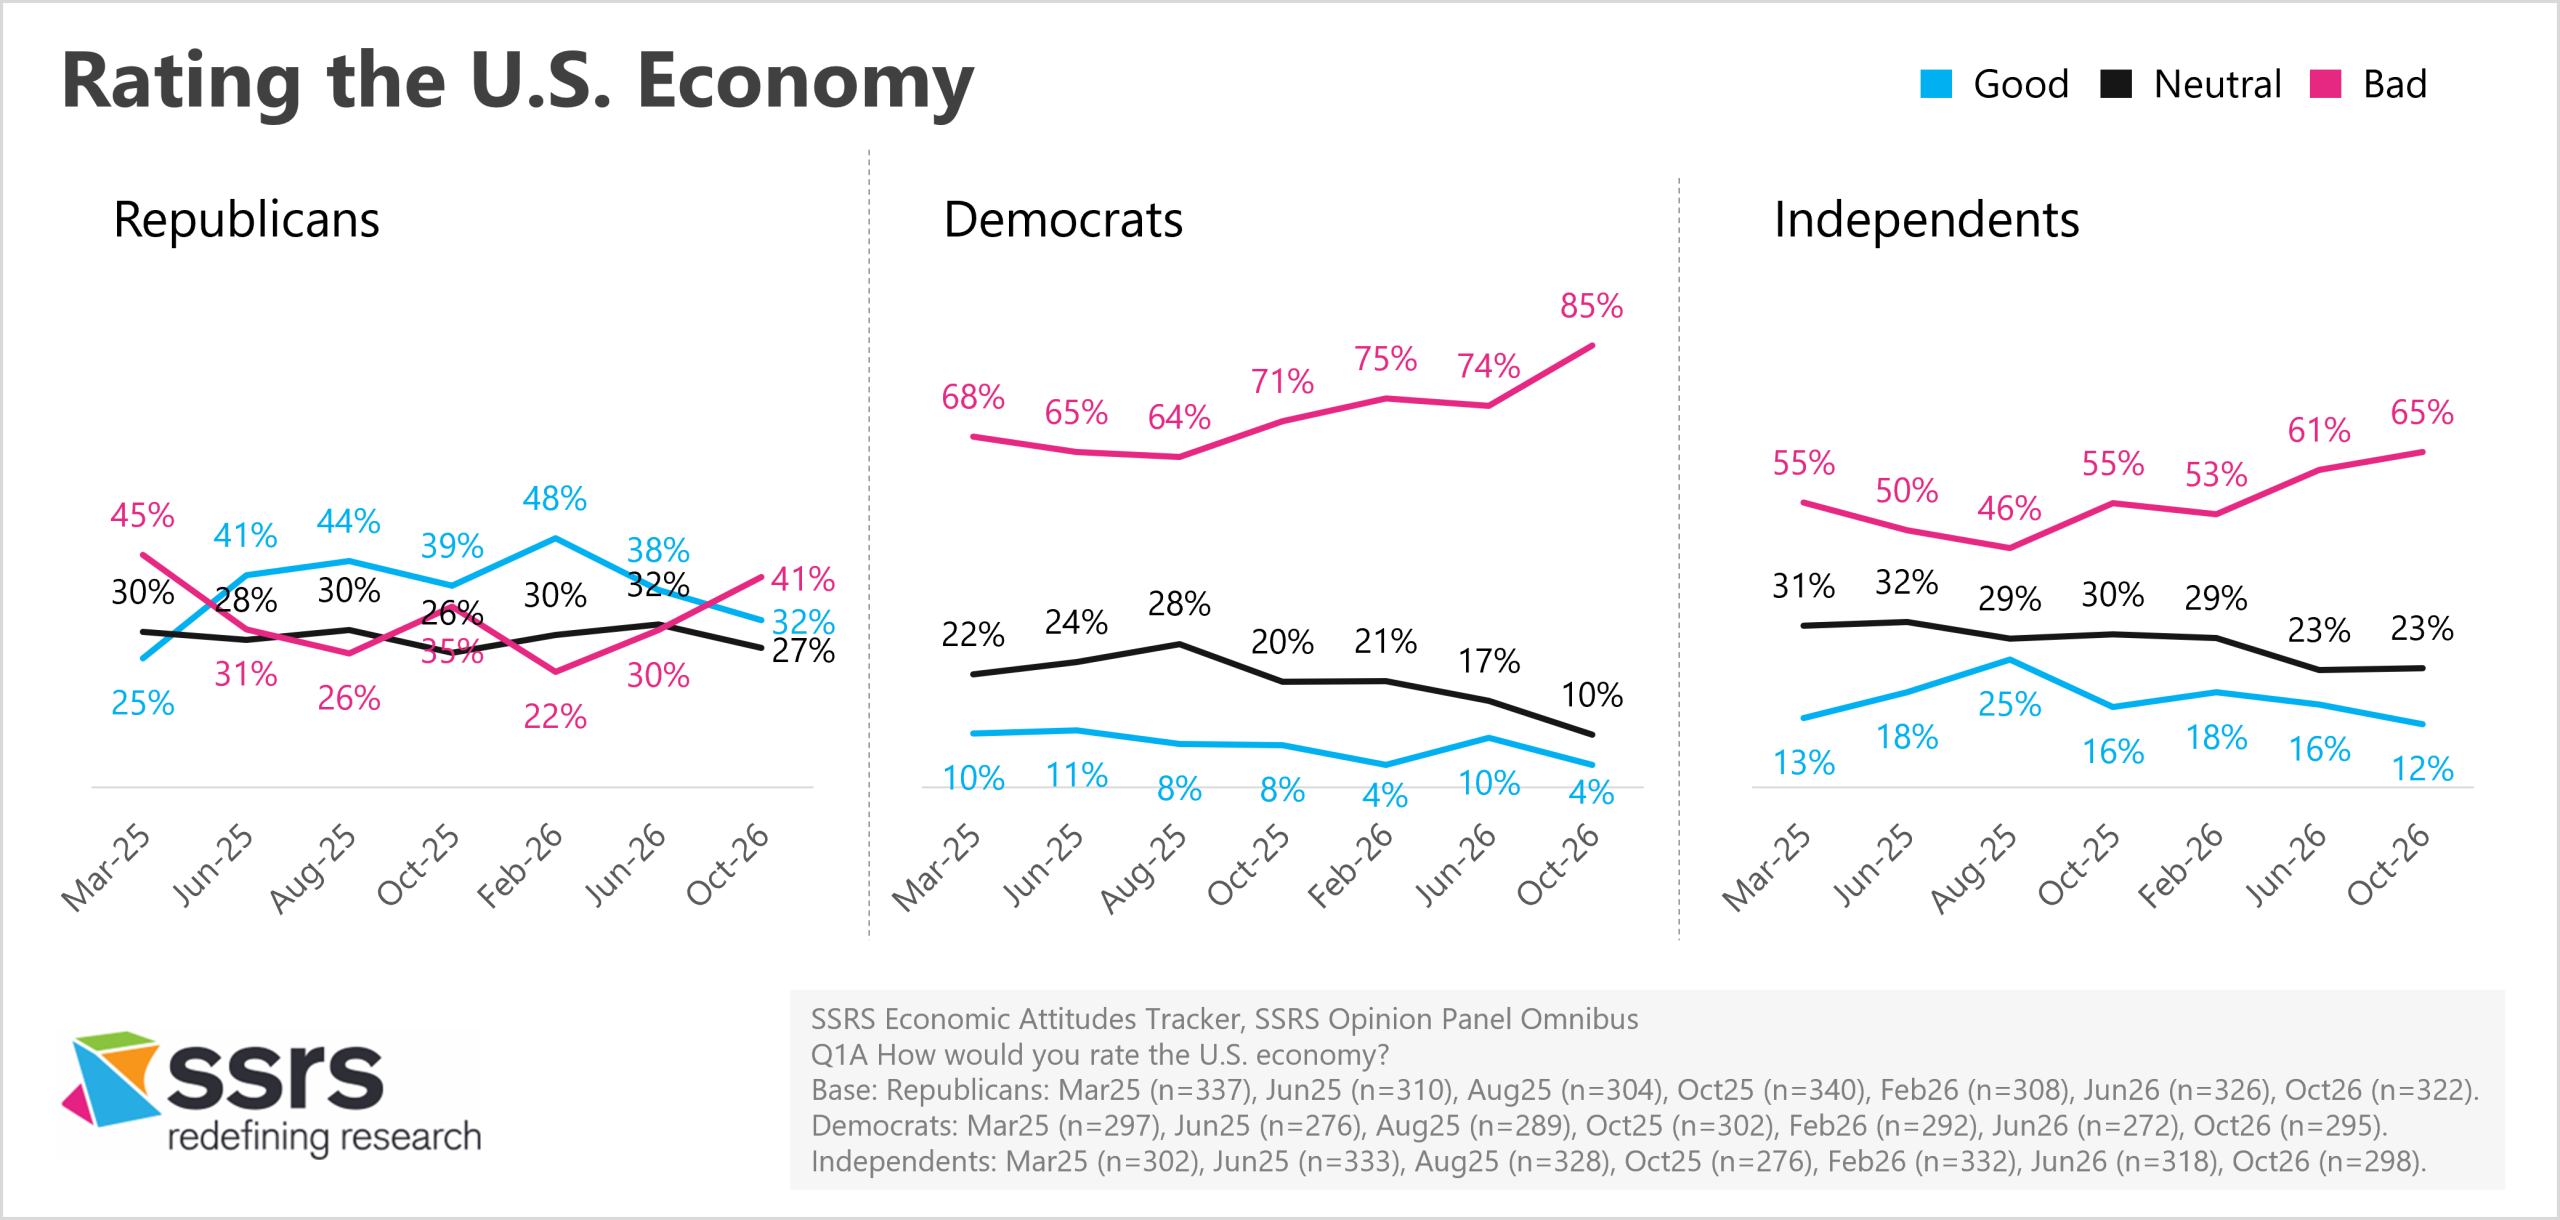
Across the political spectrum, the sentiment that the U.S. economy is in bad shape is building.
Republicans have been more optimistic about the U.S. economy over the past 17 months, but their views have shifted significantly in 2026. For the first time since March 2025, Republicans are more likely to rate the U.S. economy as bad than good: 41% describe it as “very bad’ or “bad,” while 32% say it is “very good’ or “good’.
The vast majority of Democrats are pessimistic about the economy, with 85% rating it ‘very bad’ or “bad’. Further, in October 2026, about one in three Democrats (36%) described the economy as “very bad,” up 14 percentage points from four months earlier.
Pessimism among independents has steadily increased since August 2025. Over the past four months, it has risen sharply, with 65% now rating the U.S. economy ‘very bad’ or ‘bad.’
Both Republicans and Democrats are increasingly cautious about making major financial commitments. Compared with August 2025, both Republicans and Democrats are significantly more likely to say it is a bad time to buy or sell a home (15-point increase for each), to buy a car (16-point and 10-point increases, respectively), or to start a business (11-point and 10-point increases, respectively).
Taken together, these findings point to a significant trend heading into the 2026 midterm election: economic concerns are not only widespread but intensifying.
Americans report concern about the cost of living, describe adjusting their everyday spending, and express growing reluctance to make major financial or life decisions. These attitudes appear across demographic and political groups, suggesting that economic concern is both broad-based and deeply felt.
Whether these attitudes shift in the months ahead will be an important indicator to watch. For now, the Economic Attitudes Tracker shows economic pessimism at its highest level since the study began.
Want more info on SSRS Financial & Economic research?
We'd love to work together! Email us and we'll get right back to you.
Methodology
The Economic Attitudes Tracker is conducted by SSRS on its Opinion Panel Omnibus platform. The SSRS Opinion Panel Omnibus is a national, twice-per-month, probability-based survey.
View the topline >>
Economic Attitudes Tracker waves include:
- March 21 – March 24, 2025, among a sample of 1,031 panelists. The survey was conducted via web (n=1,001) and telephone (n=30) and administered in English (n=1,005) and Spanish (n=26). The margin of error for total respondents is +/-3.8 percentage points at the 95% confidence level. The design effect is 1.54.
- June 6 – June 10, 2025, among a sample of 1,029 respondents. The survey was conducted via web (n=999) and telephone (n=30) and administered in English (n=1,004) and Spanish (n=25). The margin of error for total respondents is +/-3.5 percentage points at the 95% confidence level. The design effect is 1.29.
- August 1 – August 4, 2025, among a sample of 1,030 respondents. The survey was conducted via web (n=1,000) and telephone (n=30) and administered in English (n=1,004) and Spanish (n=26). The margin of error for total respondents is +/-3.5 percentage points at the 95% confidence level. The total sample design effect for this survey is 1.31.
- October 16 – October 19, 2025, among a sample of 1,033 respondents. The survey was conducted via web (n=1,003) and telephone (n=30) and administered in English (n=1,007) and Spanish (n=26). The margin of error for total respondents is +/-3.5 percentage points at the 95% confidence level. The total sample design effect for this survey is 1.34. SSRS recontacted five respondents from the Omnibus survey to invite them to participate in a qualitative in-depth follow-up interview. Each interview lasted 30-minutes and was conducted over Zoom with an SSRS researcher between October 28 – 30, 2025.
- February 5 – February 9, 2026, among a sample of 1,030 respondents. The survey was conducted via web (n=1,000) and telephone (n=30) and administered in English (n=1,004) and Spanish (n=26). The margin of error for total respondents is +/-3.4 percentage points at the 95% confidence level. The total sample design effect for this survey is 1.26.
- June 18 – June 22, 2026 among a sample of 1,030 respondents. The survey was conducted via web (n=1,000) and telephone (n=30) and administered in English (n=1,004) and Spanish (n=26). The margin of error for total respondents is +/-3.4 percentage points at the 95% confidence level. The total sample design effect for this survey is 1.24.
- October 1 – October 4, 2026 among a sample of 1,033 respondents. The survey was conducted via web (n=1,003) and telephone (n=26) and administered in English (n=1,007) and Spanish (n=26). The margin of error for total respondents is +/-3.4 percentage points at the 95% confidence level. The total sample design effect for this survey is 1.25.
All SSRS Opinion Panel Omnibus data are weighted to represent the target population of U.S. adults ages 18 or older.
The SSRS Opinion Panel Omnibus is conducted on the SSRS Opinion Panel. SSRS Opinion Panel members are recruited randomly based primarily on nationally representative ABS (Address Based Sample) design (including Hawaii and Alaska). ABS respondents are randomly sampled by Marketing Systems Group (MSG) through the U.S. Postal Service’s Computerized Delivery Sequence File (CDS), a regularly updated listing of all known addresses in the U.S. For the SSRS Opinion Panel, known business addresses are excluded from the sample frame. Additional panelists are recruited via random digit dial (RDD) telephone sample of cell phone numbers connected to a prepaid cell phone. This sample is selected by MSG from the cell phone RDD frame using a flag that identifies prepaid numbers. Prepaid cell numbers are associated with cell phones that are “pay as you go” and do not require a contract.
The SSRS Opinion Panel is a multi-mode panel (web and phone). Most panelists take self-administered web surveys; however, the option to take surveys conducted by a live telephone interviewer is available to those who do not use the internet as well as those who use the internet but are reluctant to take surveys online.